Emission Analysis
A projected token supply/emission analysis through Tokenomist Standard. Stay ahead of the market and easily compare across projects or allocations.
Filter by
Top 300
Inflation Rate Comparison (since TGE)
Resolution
Time Period
Loading...
Project | Current Inflation Rate |
|---|
Top 300 filter applied. Tokens with a market cap below rank 300 may not appear.
Loading...
Inflation Rate Comparison (since TGE)
Only top 6 tokens are shown in the chart
Annualized Inflation Comparison
Loading...
Individual Token Charts
Note: Y-axis scale varies per chart for better visualization of each token's trend
Loading...
Tokenomist API
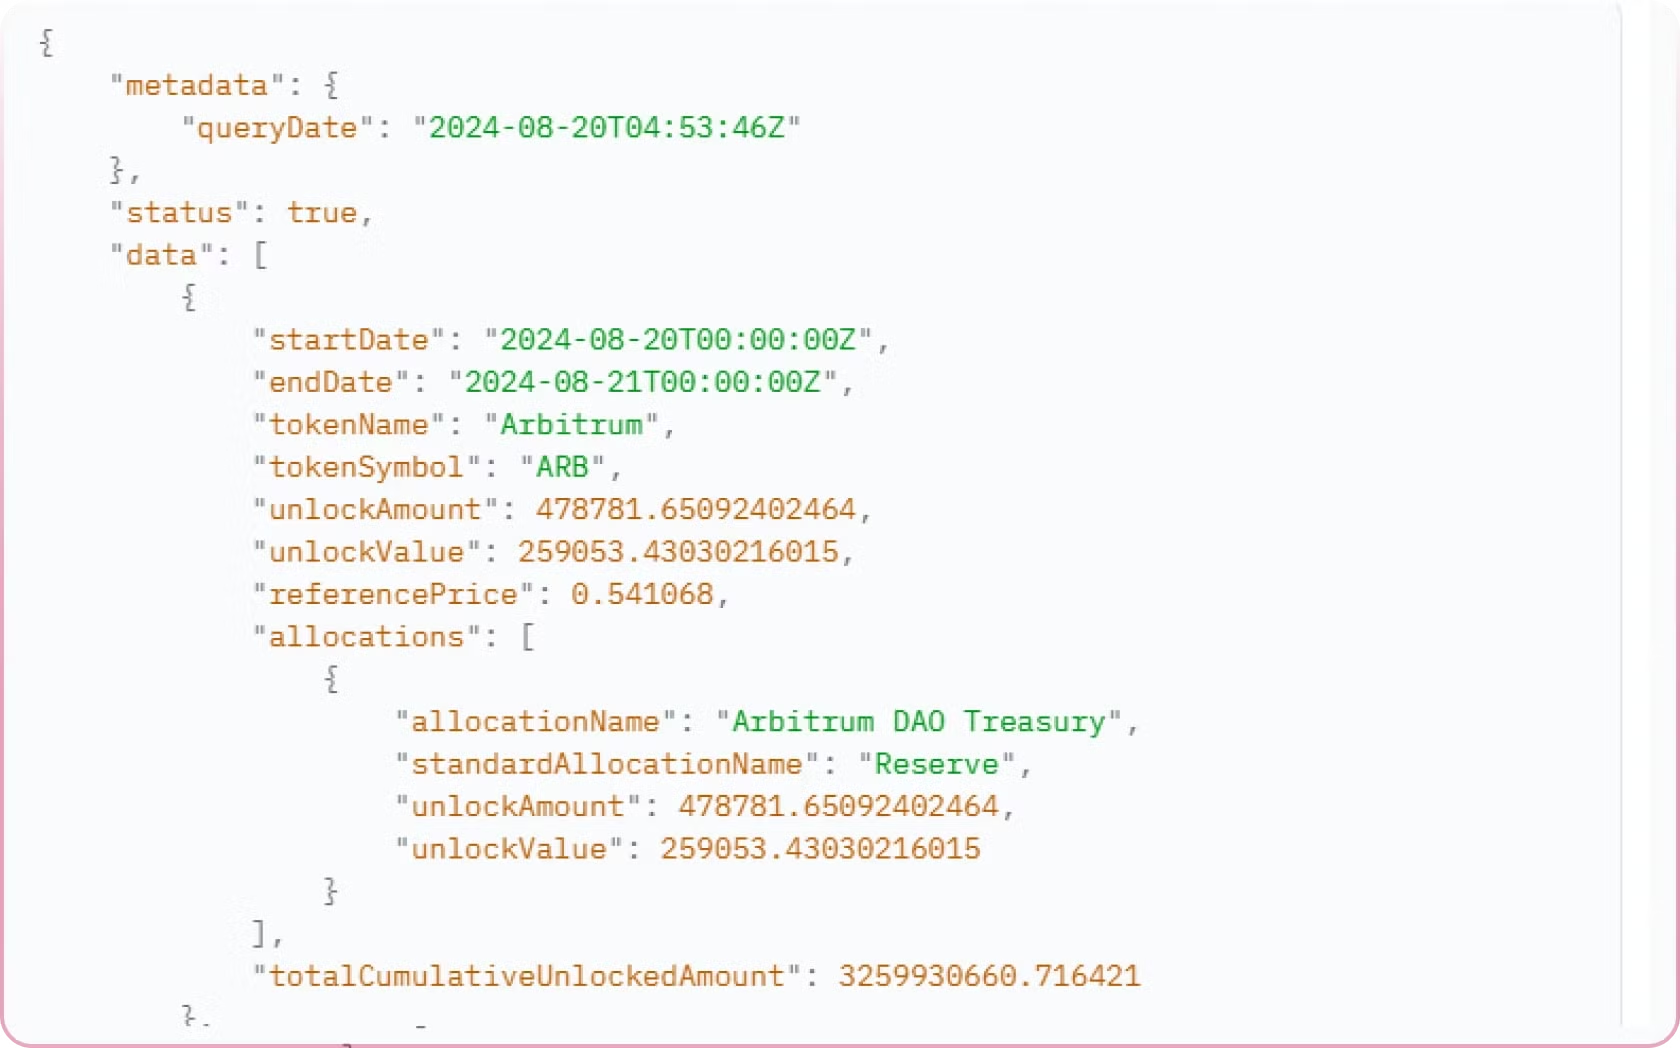
Historical Emission Analytics
A time series of token inflation with allocation breakdown. Including Cliff unlocks and linear unlocks that is releasing continuously
Tracked Value
10 Years+
Tokenomics Data
1,500+
Tracked On chain, Off chain Sources
Tokenomist Research
Explore morePress & Mentions
See all press & mentions
Tokenomist.ai provides a complete solution for supply-side tokenomics data. Analyze future token emissions, track vesting schedules, and compare standardized tokenomics and allocation across projects to gain actionable insights