What the Market Does Around a Token Unlock

Across 846 unlocks from 2022 to 2026, the market changed before and after the date more than on it. Ahead of the biggest unlocks, the short side of the futures market paid more often to stay in. In the week after, price momentum faded. Market data through November 2, 2026.
This is research, not investment advice. It describes how the market behaved around past unlocks, on average. It does not predict what any token will do next, and it does not recommend buying, selling or shorting anything.
Key Takeaways
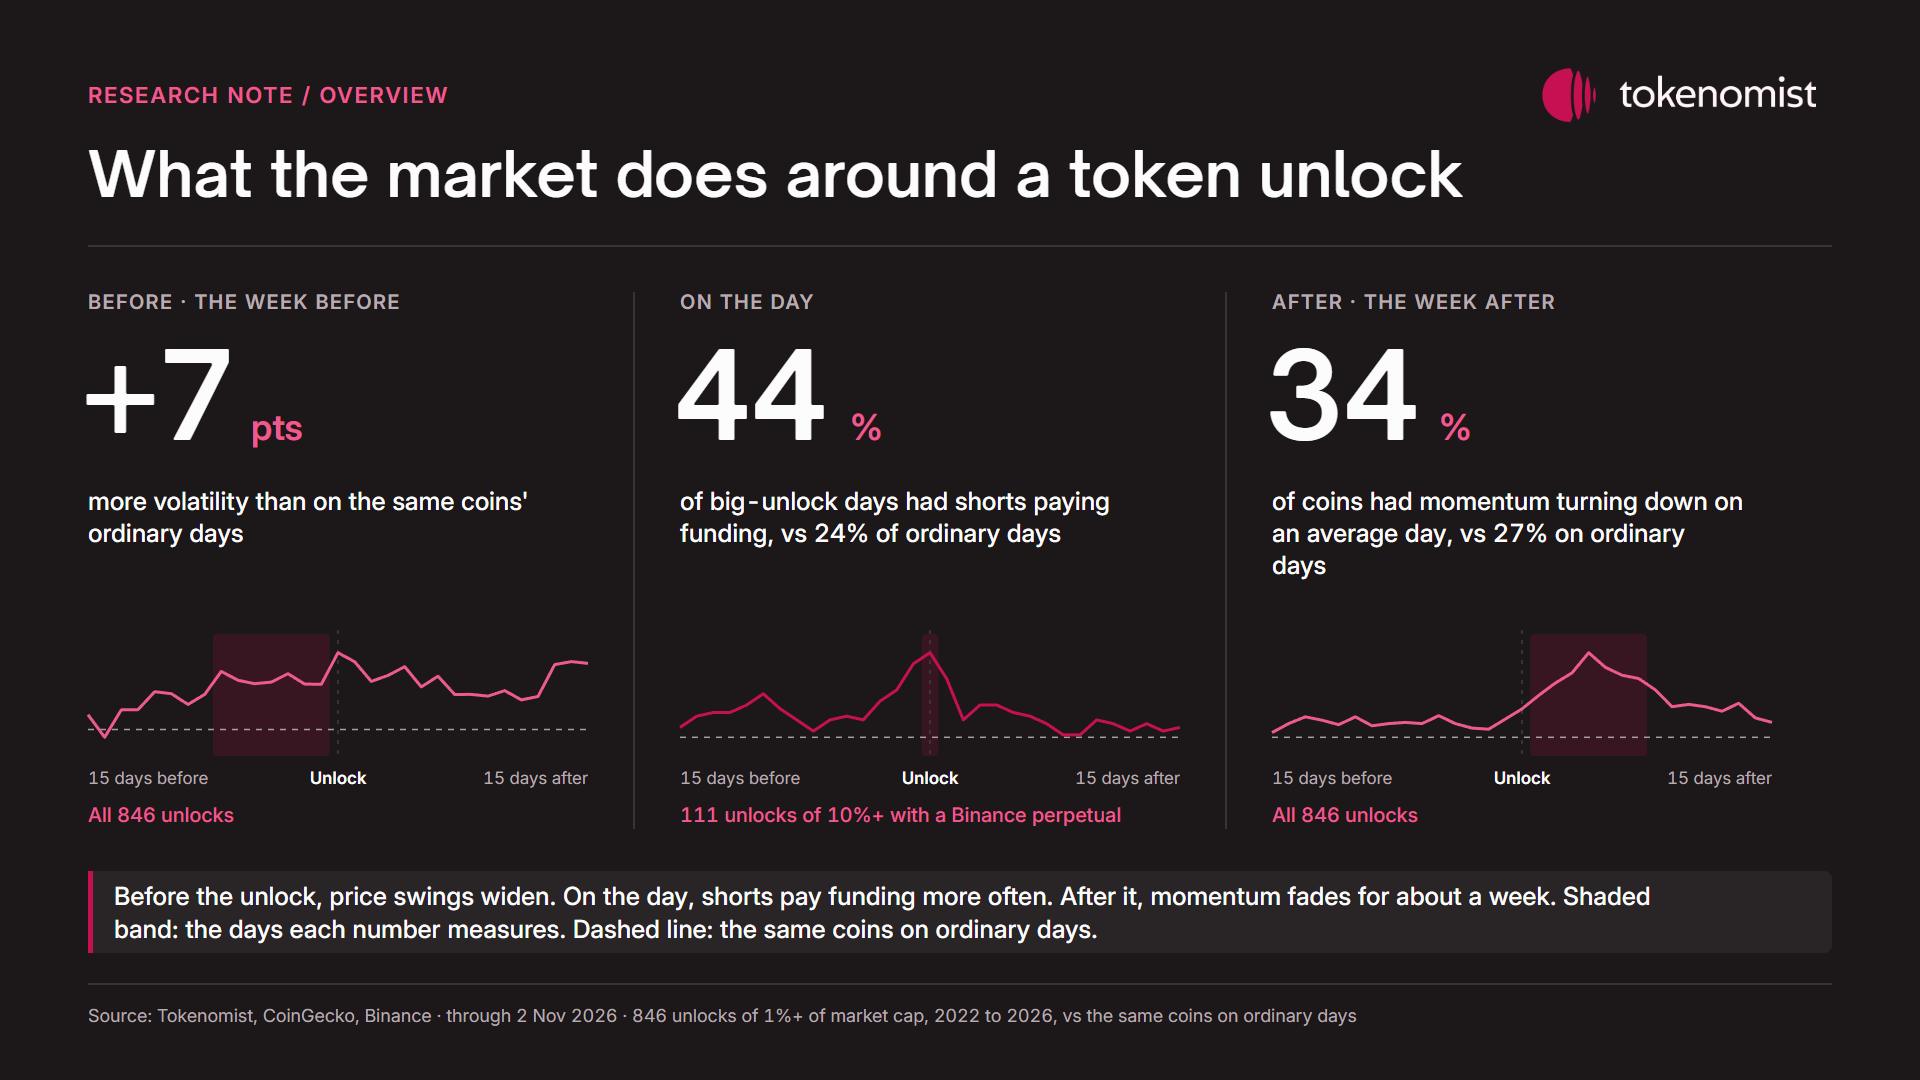
- Before the biggest unlocks, shorts pay more often. For unlocks of 10% of market cap or more, funding was negative on 44 of every 100 unlock days, against 24 on ordinary days. Negative funding means traders betting on a fall pay a fee to keep the bet open.
- Price swings widen a week before the date. Seven-day volatility ran about 7 percentage points above each coin's normal level in the week before the unlock, and 8 on the day. A 2024 to 2026 result; not seen for unlocks of 3% to 10% of market cap.
- Momentum fades after the date. In the week after an unlock, momentum was turning down on 6 more coins in every 100 than normal, and on 9 more for coins under a year old. Momentum is price in another form; what is new here is the timing, one week rather than a month.
- Futures positions build around unlocks only in bear markets. In bear markets the value of open futures positions rose by about 0.2% of market cap around the date. In bull markets it did not.
These are patterns across many unlocks, not a forecast for any one coin.
Track every scheduled unlock on Tokenomist: each one is listed with its date, size and recipient group, and the Tokenomist API serves the same history for your own study.


What an unlock is and how each indicator works
A cliff unlock is a block of tokens that becomes free to move on a set date. The tokens usually belong to the team, early investors, a foundation or a community pool.
Before the date, the tokens exist but cannot move. After it, the holder can sell them, stake them or keep them. Unlocked is not sold.
Tokenomist tracks every scheduled unlock with its date, size and recipient group. Part 1 of this series read 236 of those dates against price. It found that the price effect sat in young tokens with a thin float (few tokens trading freely), and that most of the move came before the date.
This part asks three questions a holder or trader would ask anyway, and reads one or two market gauges for each.
| Question | What we look at |
|---|---|
| Before the date, does the market get nervous? | Volatility (how much the price swings) and funding (which side of the futures market is paying to hold its bets) |
| On the day, does anything happen in plain buying and selling? | Turnover (trading volume as a share of market cap) |
| After the date, does the price keep its momentum? | MACD and RSI, two momentum gauges built from price |
A sixth gauge, open interest (the value of futures positions still open), answers a side question: do traders add positions around the date at all?
Each gauge is explained in the section that uses it. Below, an ordinary day or quiet date means the same coin on a day with no unlock close by.
1. Before the date: price swings widen, and shorts pay up into the biggest unlocks
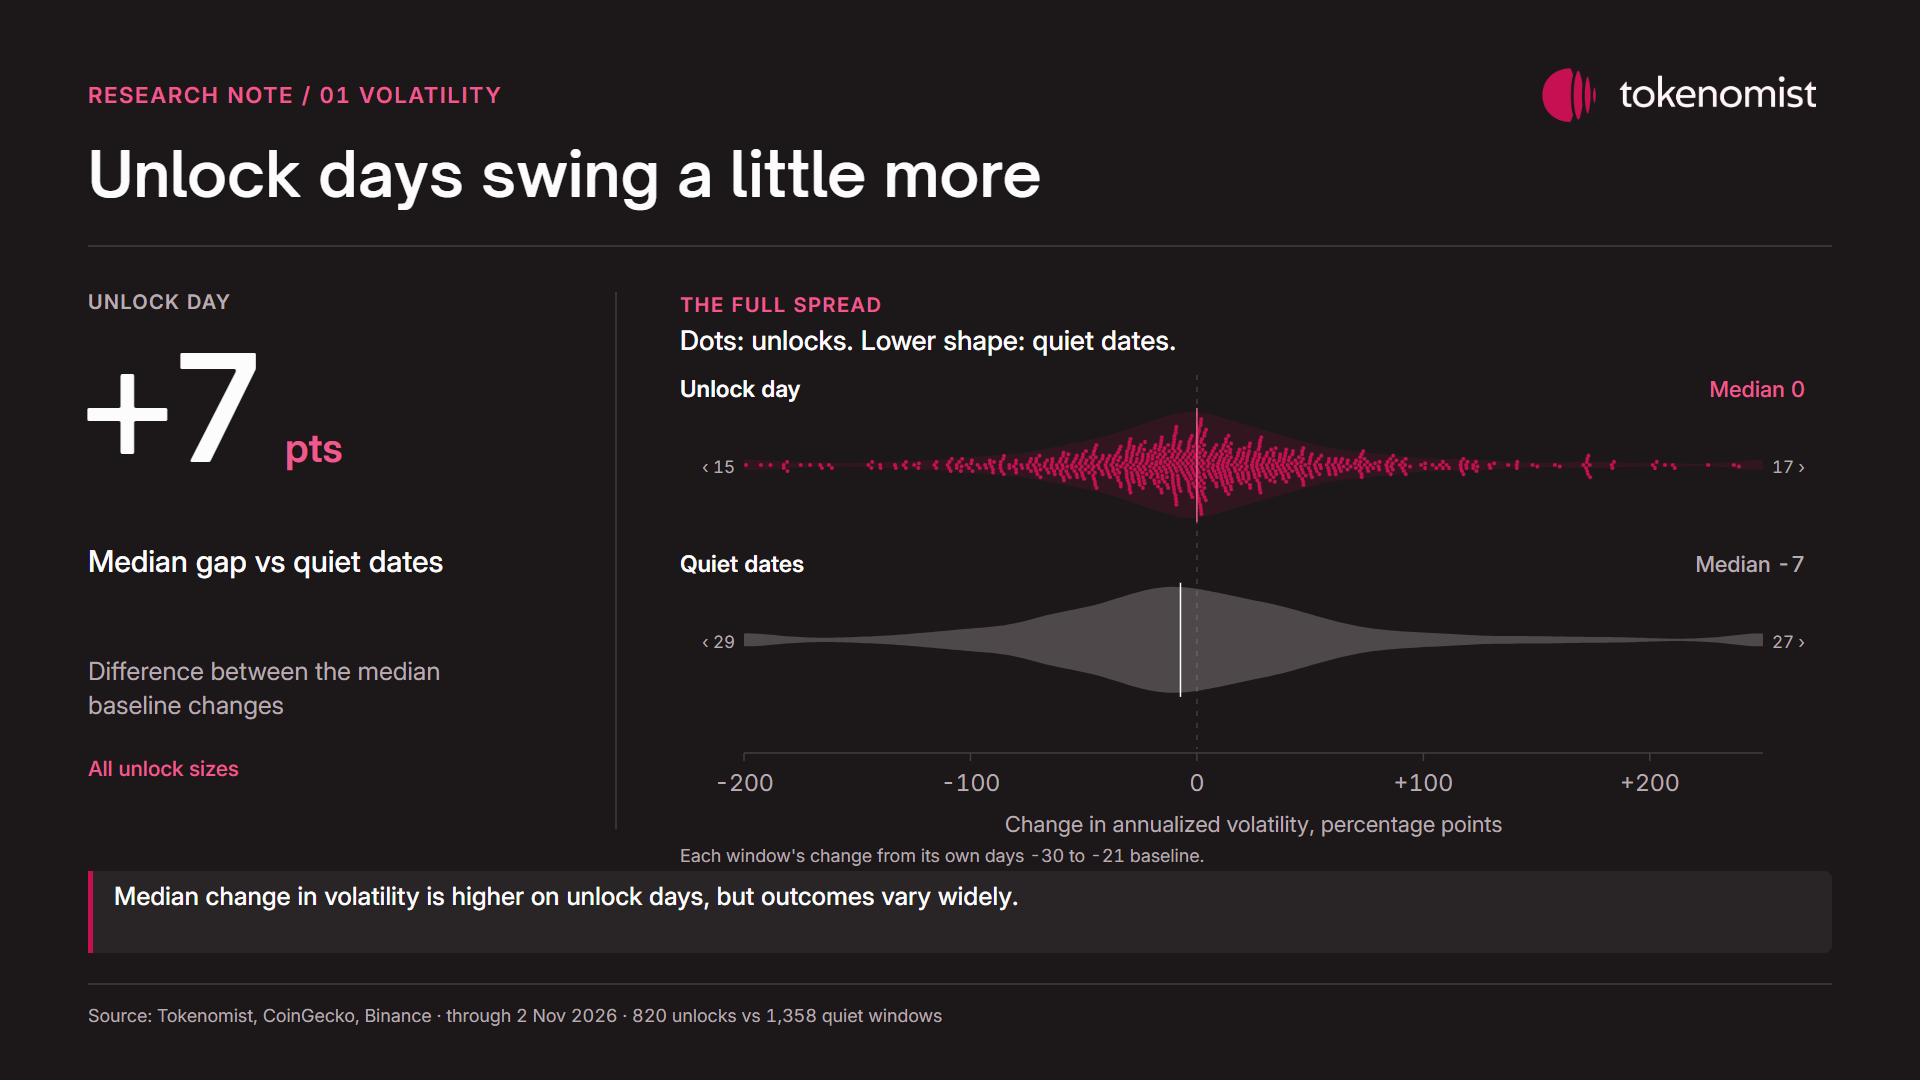
Seven-day volatility is how much the daily closing price has been swinging, shown as a yearly rate. Traders normally use it to judge how risky a coin is right now: it says how big the daily moves have been, not which way. It starts climbing about a week before the date. In that week it ran about 7 percentage points above each coin's normal level: from 60% to 67%, say, not 7% more than 60%. Normal here means the coin's own level in the days 30 to 21 before the unlock. On the unlock day the gap was 8 percentage points of volatility. Then it faded back over the two weeks after the date.
The rise is a 2024 to 2026 result. It shows up in both bull and bear markets, but not for mid-sized unlocks of 3% to 10% of market cap, and not in 2022 to 2023 (see section 7).
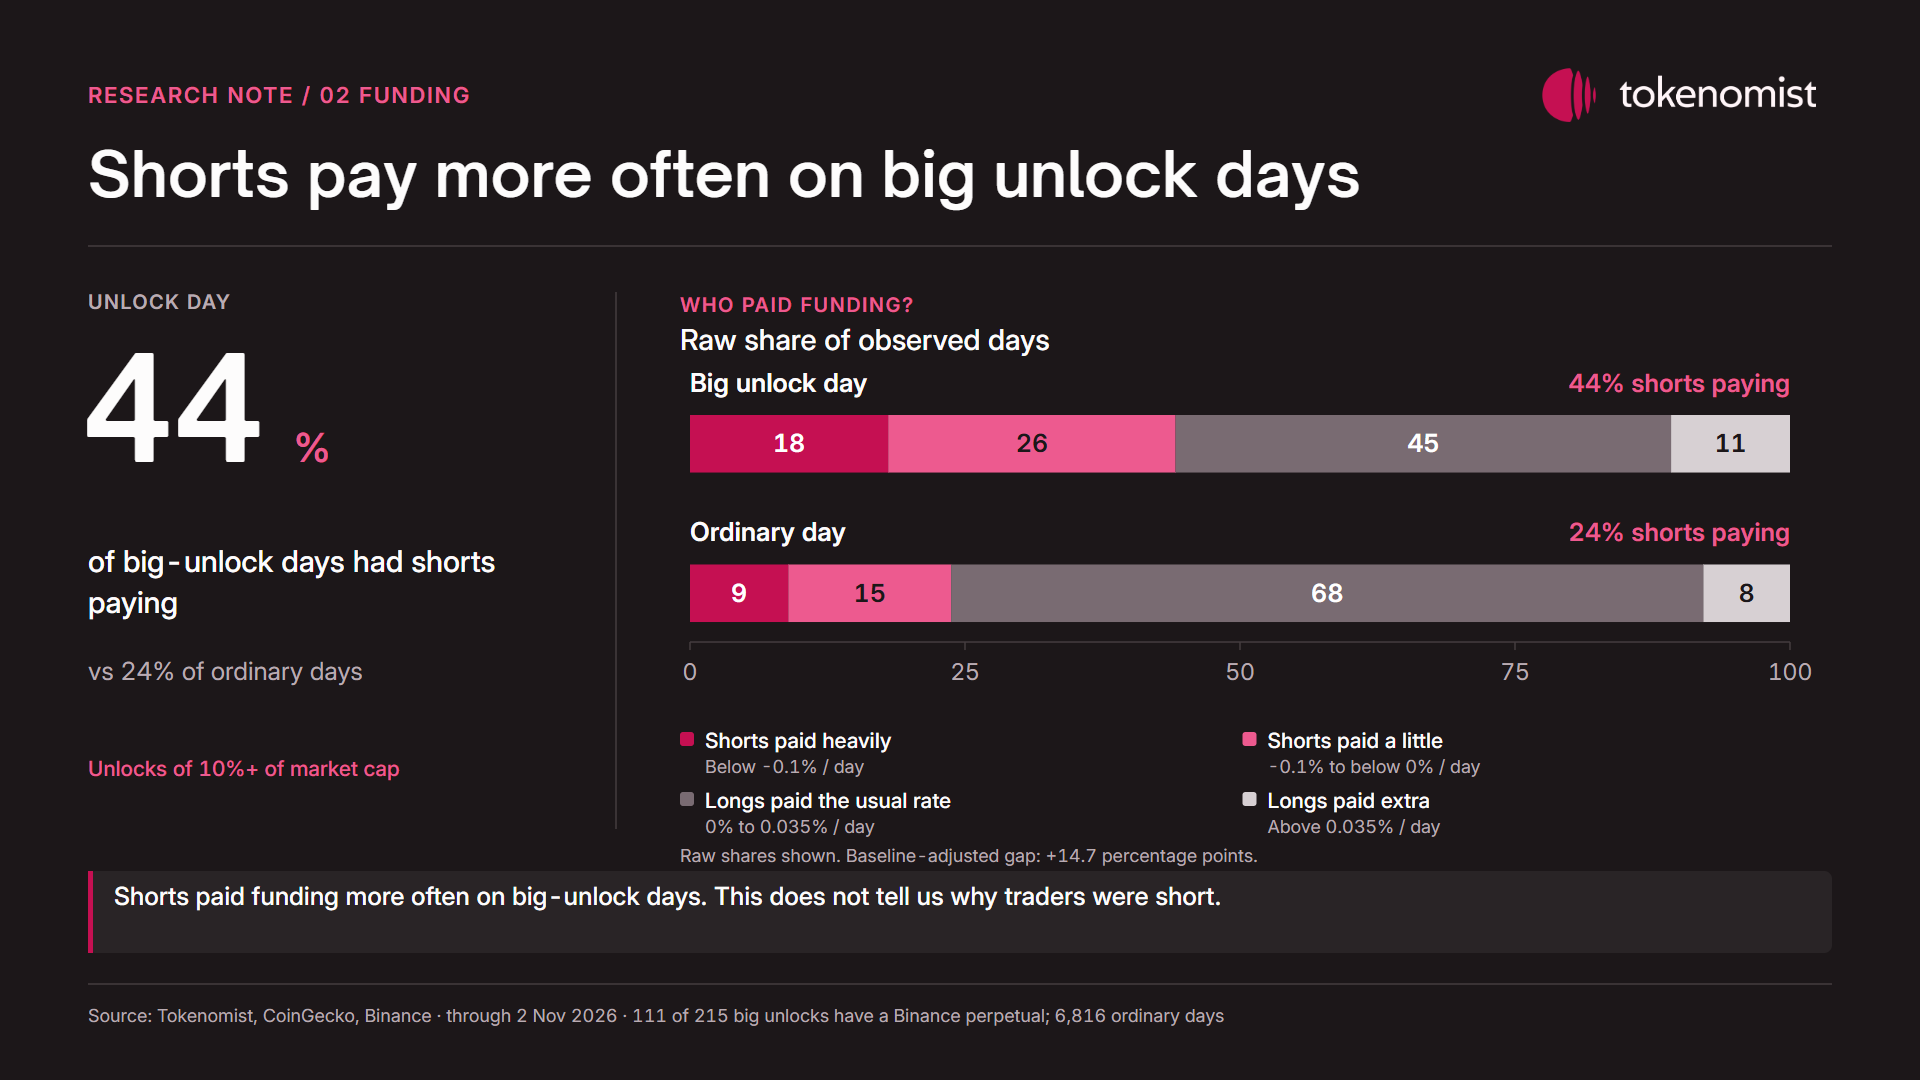
The second gauge needs three words first. A perpetual is a futures contract with no expiry date, the way most crypto traders bet with leverage. A long is a bet that the price rises; a short is a bet that it falls. Funding is the fee that keeps a perpetual's price close to the price of the coin itself. Every few hours (eight for Bitcoin, one to four for most small coins), one side pays the other. When funding is positive, longs pay shorts. When it is negative, shorts pay longs, which means the short side is crowded and paying to stay in. Traders normally read funding as a crowd gauge: it shows which side of the futures market is leaning hardest, and paying for it. Negative funding can also come from holders or market makers hedging with a short, so it shows which side leans, not why.
Ahead of the biggest unlocks, funding is where the futures market shows up. For unlocks of 10% of market cap or more, funding was negative on 41% of coins on the day before the date and on 44% on the unlock day. On ordinary days for the same coins, it was 24%. Put another way, shorts were paying on 44 of every 100 big-unlock days, against 24 of every 100 ordinary days. Those are raw shares; after the adjustment described in section 6, the gap on the day is about 15 coins in every 100 rather than 20.
Looking past the date for a moment: three days after a big unlock, funding was negative on 32% of coins. A week after, on 27%. Section 3 picks up the after-date story.
The typical funding rate (the median) barely moved, because most days sit at Binance's base rate, the small fixed rate charged when neither side is crowded. The signal is in how often funding flips negative.
For smaller unlocks, between 1% and 10% of market cap, we found no clear change in the share of negative-funding days.
Funding is paid by the crowded side of the trade. A short that pays to stay open into the date is a bet someone chose to hold through it. That is a different thing from a holder selling on the day.
In short: About a week before a big unlock, prices start swinging more. For the very biggest unlocks, the short side ends up paying to stay in almost twice as often as on ordinary days. Smaller unlocks show no sign of this in funding.
2. On the day: quiet in spot, except for the biggest unlocks
Spot trading means buying and selling the coin itself, not futures. Turnover is the day's trading volume as a share of market cap. Traders normally use it to see how much attention a coin is getting, and whether a price move has real trading behind it. For the average unlock, nothing in spot trading marks the day. Turnover sat where it sits on ordinary days.
The share of volume that came from aggressive buyers (those who pay up to buy right now) moved by a fifth of a percentage point of volume. That is clear in the statistics, but too small to matter to a trader.
Only the biggest unlocks traded more. For unlocks of 10% of market cap or more, daily volume ran about 1% of market cap above the coins' own level on the day. Normal turnover for these coins runs near 15% of market cap a day, so that is a small rise, under a tenth more trading than usual. It stayed slightly elevated for the month after.
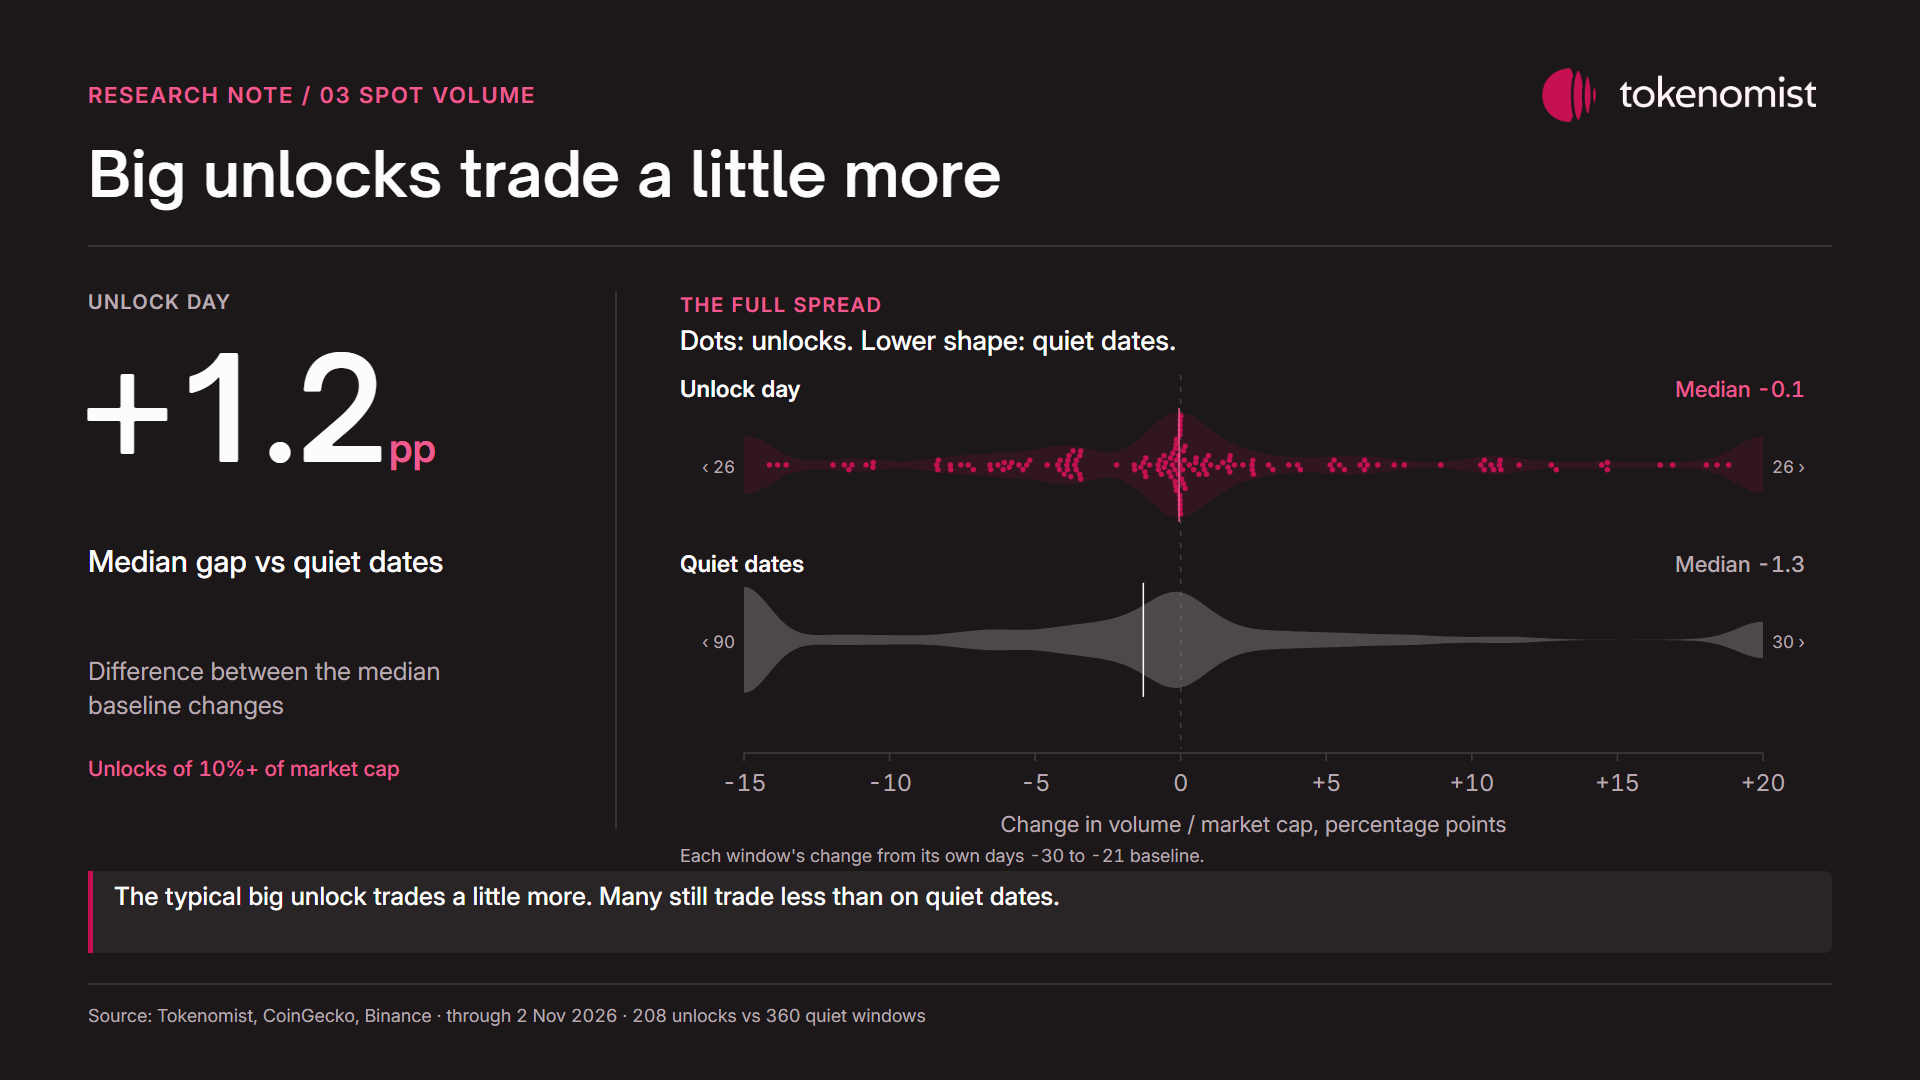
This matches the picture Part 1 drew with price. For most coins the date is an anticlimax. The exception is an unlock that is large compared with the tokens already trading.
It also answers a question Part 1 could not. If the date is quiet in spot, the extra volatility in section 1 is not explained by a wave of selling on the day. Funding moves only for the biggest unlocks and open interest only in bear markets, so neither explains the volatility rise on its own. The data does not establish what caused it.
In short: For most coins, the unlock day itself is quiet when you look at buying and selling the coin. Only the biggest unlocks trade a bit more on the day.
3. After the date: momentum fades for about a week, most on young coins
After an unlock, price momentum was more likely to weaken for about a week. For most coins, momentum (how strongly price has been rising or falling) looks ordinary before the date. After it, momentum fades.
Two gauges measure that. MACD compares a fast and a slow average of the price. "Turning down" here means its histogram (the bar chart under the line) is below zero and lower than five days earlier. It does not mean the price fell every time. Traders normally use MACD to spot a trend losing steam: when the bars shrink and drop below zero, a rise is running out of push. RSI 14 scores two weeks of gains against losses from 0 to 100. Above 70 reads as stretched. Below 30 reads as washed out. Traders normally use it to spot a move that has gone too far too fast, in either direction.
MACD was turning down on 27% of coins on ordinary days and 29% on the day before the unlock. It rose through the week after. On an average day of that week it was turning down on 34% of coins, a raw gap of 7 coins in every 100; after the adjustment described in section 6 the gap is about 6 in every 100.
RSI drifted 2 points lower on its 0 to 100 scale over the same week and stayed there for the rest of the month.
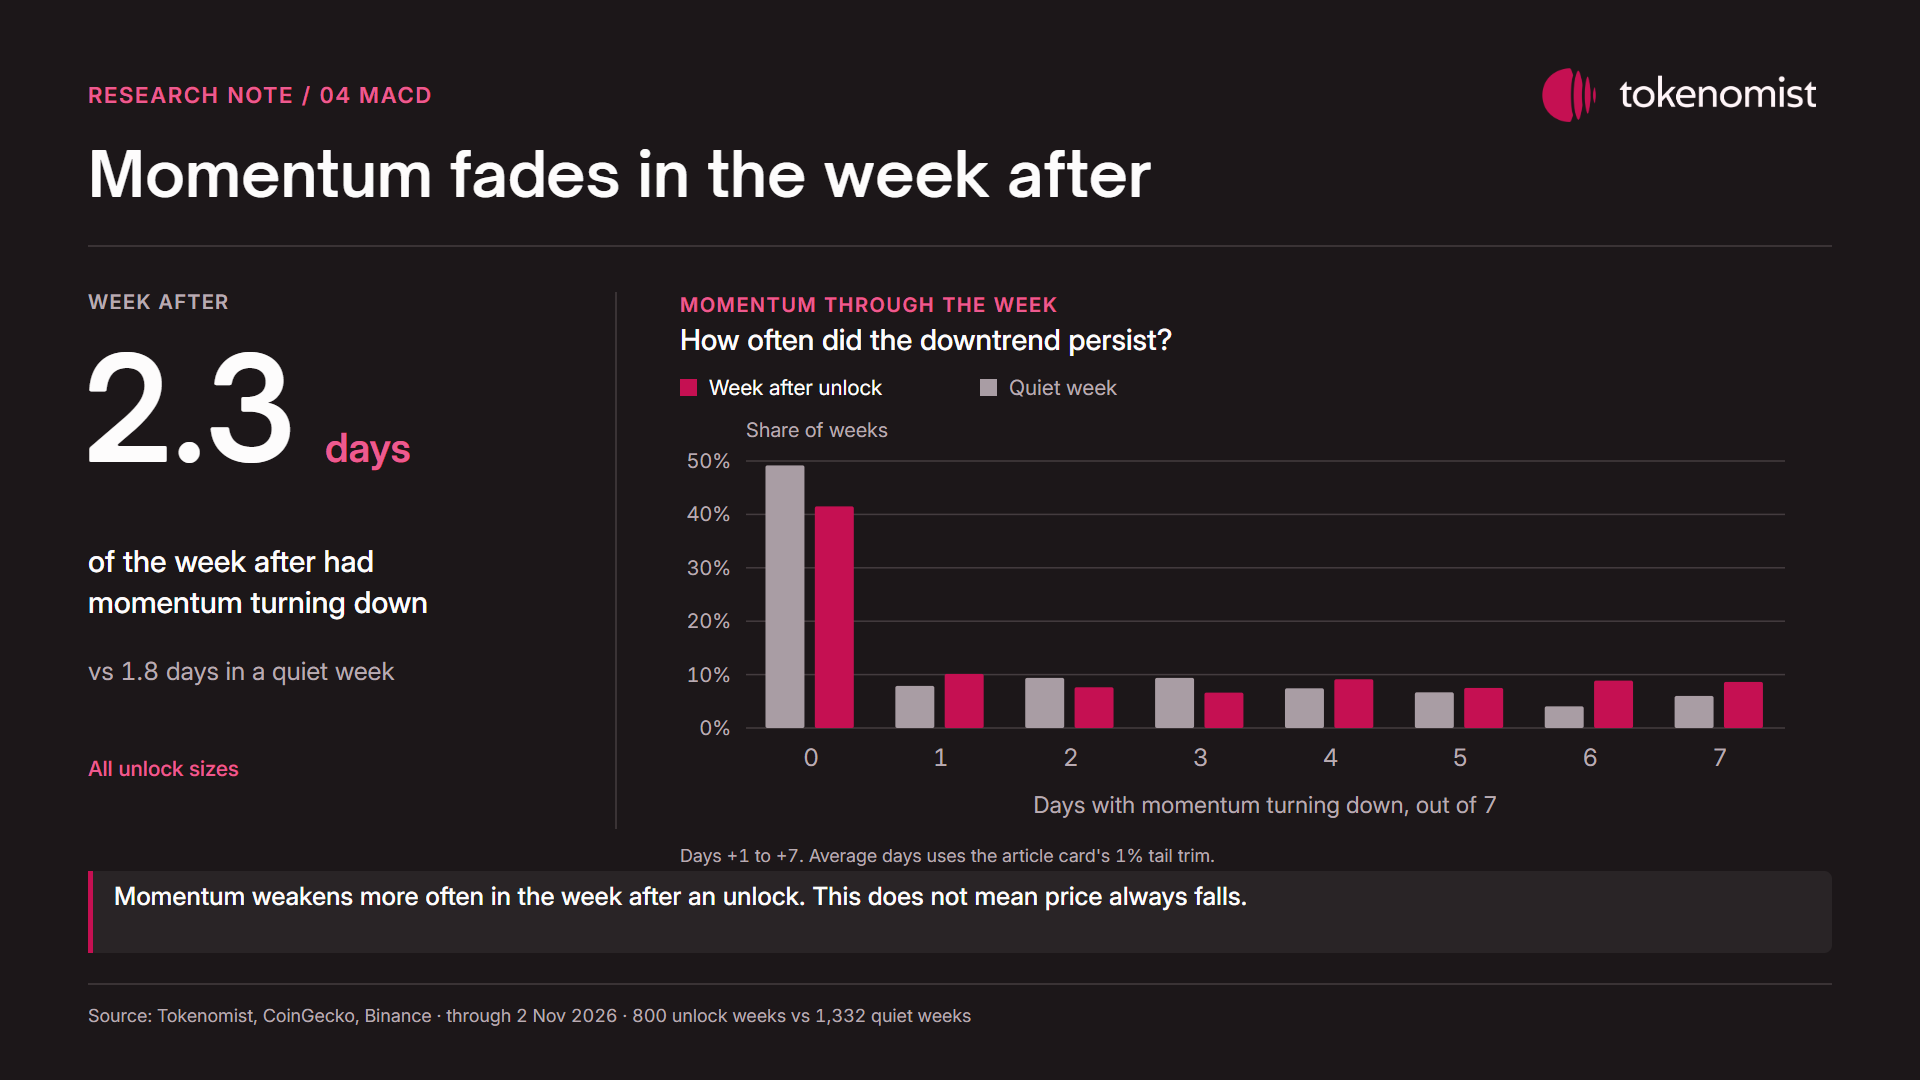
The fade is strongest where Part 1 found the price effect, in young coins. For coins under a year old, MACD was turning down on 9 more coins in every 100 than normal in the week after, and the climb started before the date. For older coins it was 5 in every 100, and it started on the day.
For unlocks of 10% of market cap or more, RSI fell 4 points below normal on its 0 to 100 scale in the week after.
Momentum gauges are built from price. So this section is Part 1's drift in price after the unlock, seen through a trader's tools. What it adds is timing. Part 1 measured a month. These gauges show that the fade is concentrated in the first week after the date: MACD turns down more often only in that week, and RSI settles about 2 points lower on its scale and stays there.
In short: For most coins, momentum looks normal going into the unlock. Then it fades for about a week afterwards, most clearly on young coins.
4. In bear markets, futures positions build around the date
Open interest is the value of perpetual positions still open at the close, as a share of market cap. Traders normally use it to see how much money is positioned in a coin's futures, and whether a move comes with new positions or with traders closing out. Whether traders add positions around an unlock lines up with the state of the market more than with the unlock itself.
In bear markets (Bitcoin below its 200-day average, the average of its last 200 daily closes, on the day before), open interest in perpetuals rose by about 0.2% of market cap on the date and stayed about 0.16% of market cap higher over the week after. Against a normal level near 4.5% of market cap, that is roughly 4% more positioning, and it held for the month.
In bull markets, open interest did not rise into the date. It drifted slightly lower in the weeks after. The gap between the two markets is itself clear by the same test as the rest of the study: bear minus bull is about 0.3% of market cap on the date and in the weeks after.
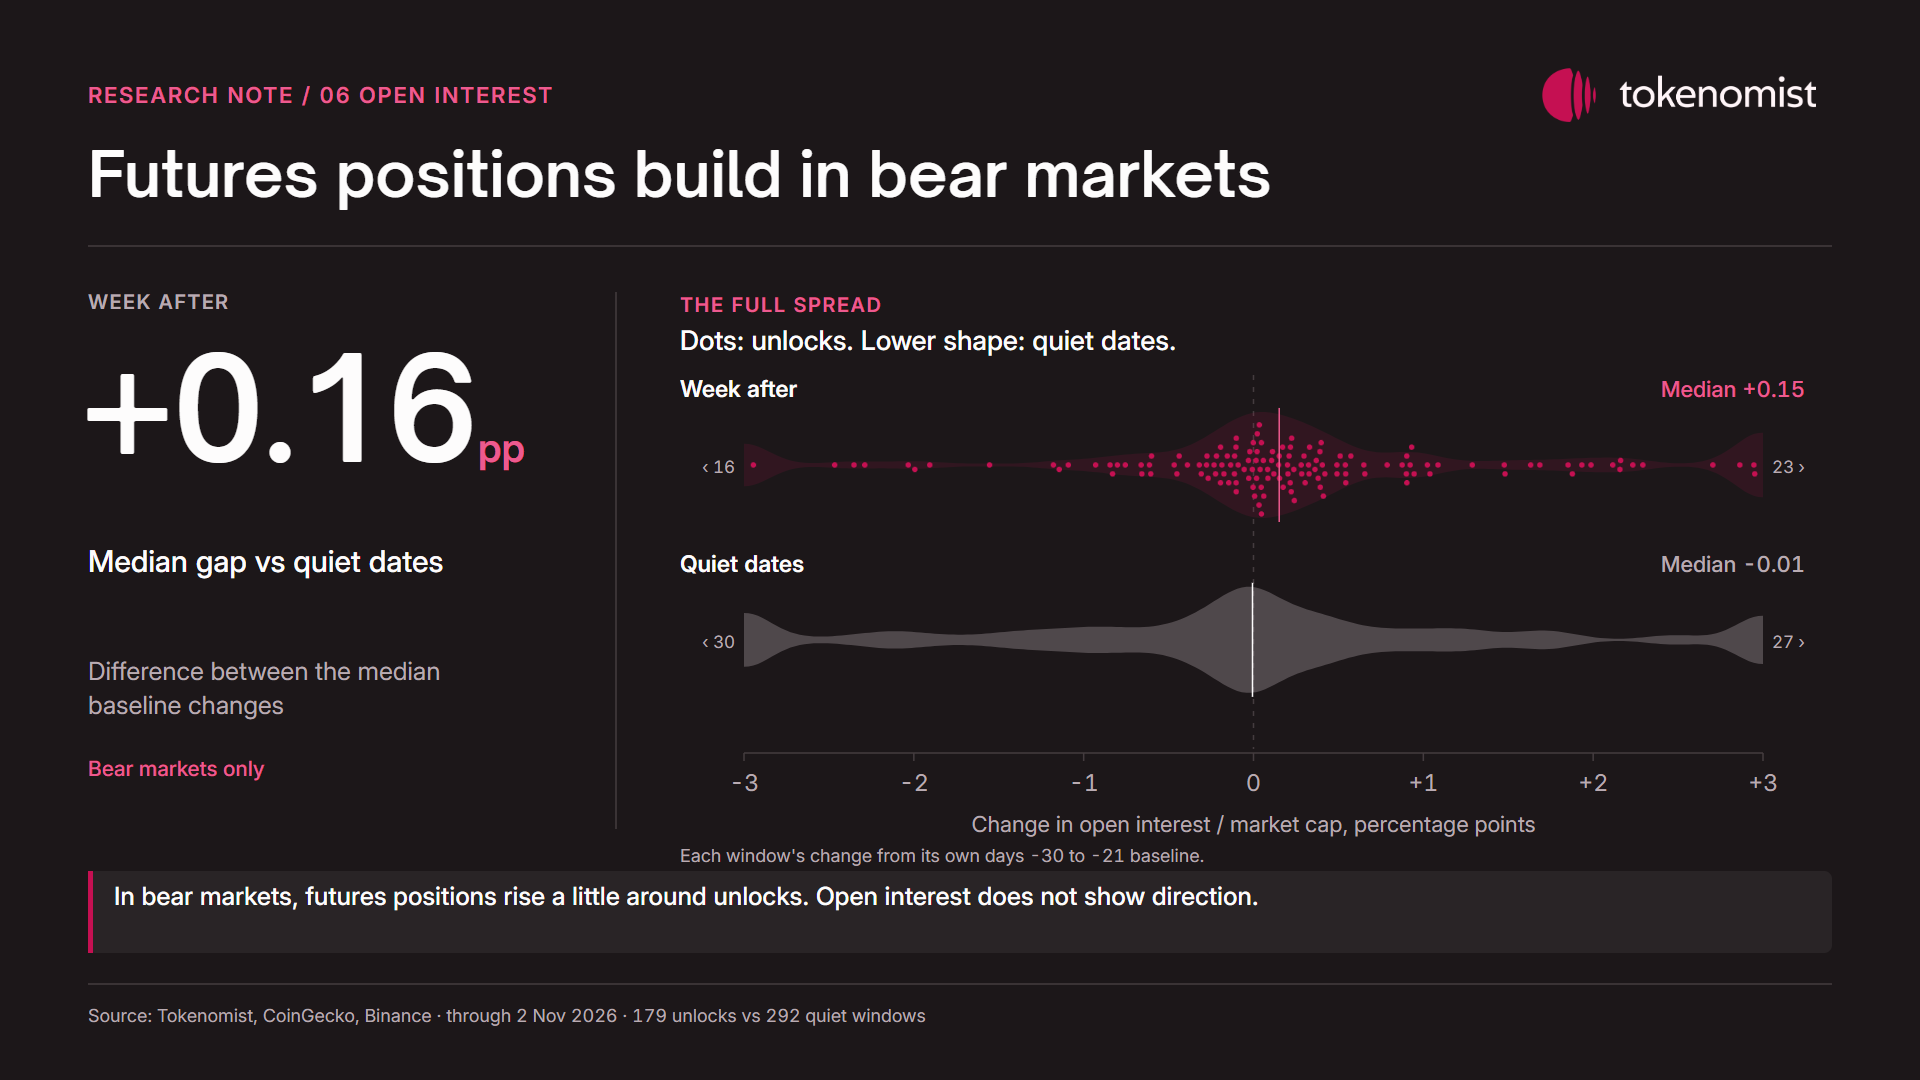
The build in bear markets is not just a 2026 quirk. In the 2022 to 2023 unlocks alone, open interest rose in the week after the date by a smaller amount. The rise was still clear by the same test as the rest of the study.
Read with the funding result in section 1, the picture fits together. In a weak market, traders add futures positions around an unlock; in a strong market they do not. Open interest alone does not say whether the new positions are long or short.
In short: Traders build up futures positions around an unlock only when the wider market is weak. When the market is strong, they do not.
5. What this means for each reader
A fair objection is that RSI and MACD are just price in another form, so this piece may only repeat Part 1. For section 3, that holds. The value there is the timing: a one-week fade, not a one-month one.
Funding and open interest are not price. They show what the people who trade the date actually did, and they move into it.
| Reader | What the data says | Number |
|---|---|---|
| Holder of a coin with a big unlock coming | The date itself is quiet in spot, except for unlocks of 10% or more; the week after is where momentum fades | Momentum turning down on 6 more coins in every 100 in the week after, 9 more for coins under a year old |
| Futures trader | Shorts are crowded into the biggest dates and pay funding to stay there; the crowd thins within three days and is near normal after a week | Negative funding on 44% of big-unlock days, 32% three days later, 24% normally |
| Anyone judging risk | Volatility rose a week out in 2024 to 2026 | +7 percentage points of volatility in the week before, +8 on the day |
| Project team scheduling a cliff | An unlock under 10% of market cap showed no clear change in funding or turnover; the momentum fade still shows, and the volatility rise only for unlocks of 1% to 3% | No clear change in the negative-funding share for unlocks of 1% to 10% |
None of this says what any one coin will do on its date. The numbers are shares and medians (middle values) across 846 unlocks. A 44% share means funding was not negative on the other 56% of those days.
In short: These patterns describe many unlocks together, not any single coin. In spot trading the unlock day is quiet, the week after is when momentum fades, and the biggest unlocks are where short sellers get crowded.
6. How the study was done
The sample is every unlock from January 2022 to October 3, 2026 that passed three tests: worth at least 1% of the coin's market cap, on a coin worth at least $10 million, with no other unlock of that size within 30 days either side. That leaves 846 unlocks on 239 coins, about three and a half times Part 1's sample, and it reaches back into the 2022 bear market.
Each indicator is read day by day, from 30 days before the unlock to 30 days after, and compared with the same coin on ordinary dates at least 45 days from any unlock (1,426 of them). Each window is first measured against the coin's own level in the days 30 to 21 before, and the quiet windows go through the same step, so a coin that is always volatile or always busy does not show up as a result. That adjustment is why the tested gaps (about 15 coins in every 100 for funding, 6 for MACD) sit below the raw ones. Not every unlock has quiet dates of its own: 133 of the 846 are on coins that unlock so often that no date is 45 days clear, so they are set against the quiet dates of the rest. Rerunning the main results on the 713 unlocks with their own quiet dates gives the same picture.
A weak market (bear market) means Bitcoin was below its 200-day average, a strong one (bull market) above it: 366 unlocks fell in bear markets and 480 in bull markets. Funding and open interest exist for about half the sample, the coins with a Binance perpetual, and for 111 of the 215 unlocks of 10% or more.
A result counts as clear only if it still holds when we redraw the sample by coin, not by unlock. This stops one coin with seventeen dated unlocks from carrying the result. The study tested six gauges over four windows and about a dozen subgroups, each with its own 90% band, so a few clear cells are expected by chance alone. The article leans on the results that are large and repeat across windows (funding, volatility, momentum, bear-market open interest), not on any single cell.
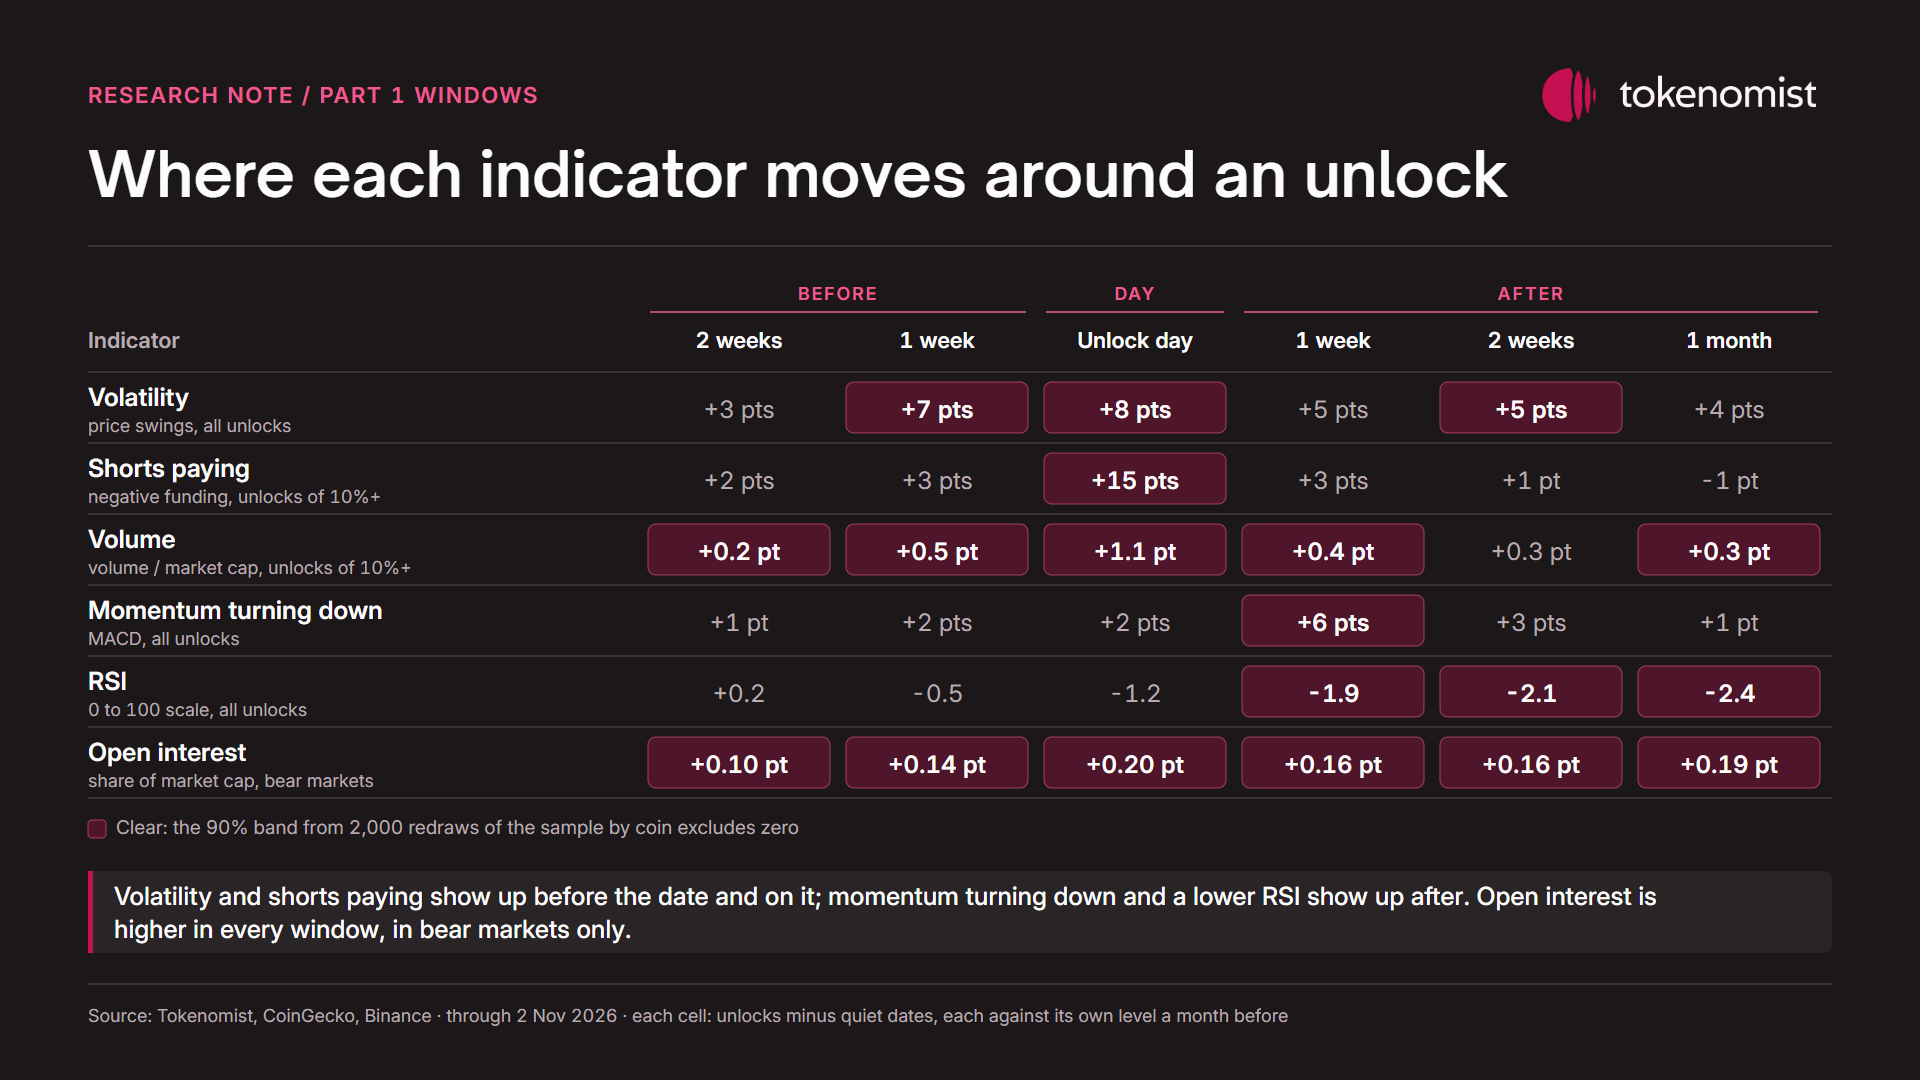
Part 1 measured price over two weeks and a month around each unlock. The table below puts every indicator on those same windows, so the two parts can be read side by side.
In short: We lined up several hundred unlocks and compared each one with the same coin on days when nothing was unlocking. That way a coin's usual habits do not fool us.
7. What to watch
- November 24, 2026, MON's cliff. The largest unlock among coins worth more than $50 million, compared with the tokens already trading: about 56% of circulating supply as Tokenomist models it. Monad has not published the team's share at the cliff. Funding on the MON perpetual the day before and on the day is a live test of section 1, though one date can neither confirm nor overturn a pattern drawn from 846 unlocks.
- Bitcoin against its 200-day average. Bitcoin closed above it on November 2, 2026. If Bitcoin stays above it, the bull-market pattern is the one that applied in the past, with no build into the date. A close below it is the condition under which the bear-market pattern showed up.
- The 2022 to 2023 check. The volatility rise is a 2024 to 2026 result. The 2022 to 2023 unlocks show none. Re-running this study once 2027 data is in will test whether that rise belongs to the current market or to unlocks.
In short: Three things will test this story: the next very large unlock, whether Bitcoin sits above or below its long-term average line, and whether the volatility rise shows up again once more data is in.
Sources
- Tokenomist: When Token Unlocks Actually Move Price (Part 1, June 29, 2026)
- Tokenomist: token unlock calendar
- CoinGecko API: coin market chart by date range
- Binance: USDT-margined futures funding rate history
- Binance: public market data archive
Methodology
- Unlocks: Tokenomist API, November 3, 2026 at 07:04 UTC, tranches summed per day; size against CoinGecko market cap the day before.
- Prices, market cap, volume: CoinGecko daily, same pull. Candles, funding, open interest: Binance USDT perpetuals through November 2, 2026, matched to coins by price.
- Bands: 2,000-draw bootstrap over coins, 90%. Every main result survives dropping the 10 most frequent unlockers, and holds on the 713 unlocks with quiet windows of their own.
- Not checked: coins with no CoinGecko history; derivatives for the 46% of unlocks with no Binance perpetual.
Disclosure: the author holds no token named in this article and has no position in, or exposure to, the token or to any project it covers. Tokenomist publishes this article and operates the unlock data it cites.
This is supply-side analysis for educational purposes. Not financial advice.
Frequently Asked Questions
Does negative funding before an unlock tell you where price goes next?
No. Negative funding means shorts are paying longs to keep their positions open. That says the short side is crowded going into the date. It does not say where price goes next. In this sample the crowded short had mostly thinned out within a week of the unlock. Part 1 found the price effect concentrated in young tokens with few coins trading freely. A crowded short on a liquid coin can be squeezed (forced to close as price rises) as easily as it can be right, and this study does not test which happens.
Which indicator moves first around an unlock?
Volatility moves first, about a week before the date. Funding follows, on the day before and on the day, but only for unlocks of 10% of market cap or more. Momentum gauges move last: for most coins MACD and RSI look ordinary going into the date and fade in the week after it. Open interest only builds into the date when Bitcoin is below its 200-day average.
Does this apply to small unlocks?
Partly. Unlocks of 3% to 10% of market cap showed the momentum fade after the date, and unlocks of 1% to 3% showed the volatility rise before it. Neither showed a clear change in funding or turnover. The futures market only shows up in funding for unlocks of 10% of market cap or more, about a quarter of the 846 in this sample.
Why compare with the same coin's ordinary days instead of with other coins?
Because coins differ far more from each other than any unlock changes them. A new coin is always more volatile than Ethereum, and a meme coin always has more negative-funding days than a stablecoin-adjacent one. So each unlock is measured against the same coin on dates with no unlock, and against its own level a month earlier. That removes each coin's habits, so what is left is what happens around the unlock.
Does an unlock mean the tokens were sold?
No. An unlock makes tokens transferable. Whether the holder sells is a separate decision, and this study does not measure flows from any recipient. It measures how the market around the coin behaved on dated unlocks compared with ordinary days, which is what a trader can see on a chart.
Recommend Article
What the Market Does Around a Token Unlock


What the Market Does Around a Token Unlock
Weekly Unlock Digest: Nov 16–22, 2026 | LayerZero's $34.69M Cliff Lands Ahead of Zero Mainnet


Weekly Unlock Digest: Nov 16–22, 2026 | LayerZero's $34.69M Cliff Lands Ahead of Zero Mainnet
NEAR's Two Inflation Cuts Keep About 196M NEAR Out of Supply by 2030
NEAR's Two Inflation Cuts Keep About 196M NEAR Out of Supply by 2030
Weekly Unlock Digest: Nov 9–15, 2026 | Allora's First-Year Cliff
Weekly Unlock Digest: Nov 9–15, 2026 | Allora's First-Year Cliff
