Price
Burn
--
Buyback
--
Dynamic
No
Claim
--
Raise Amount
$69.50M
Version 1
Updated: 24 Sep 2025
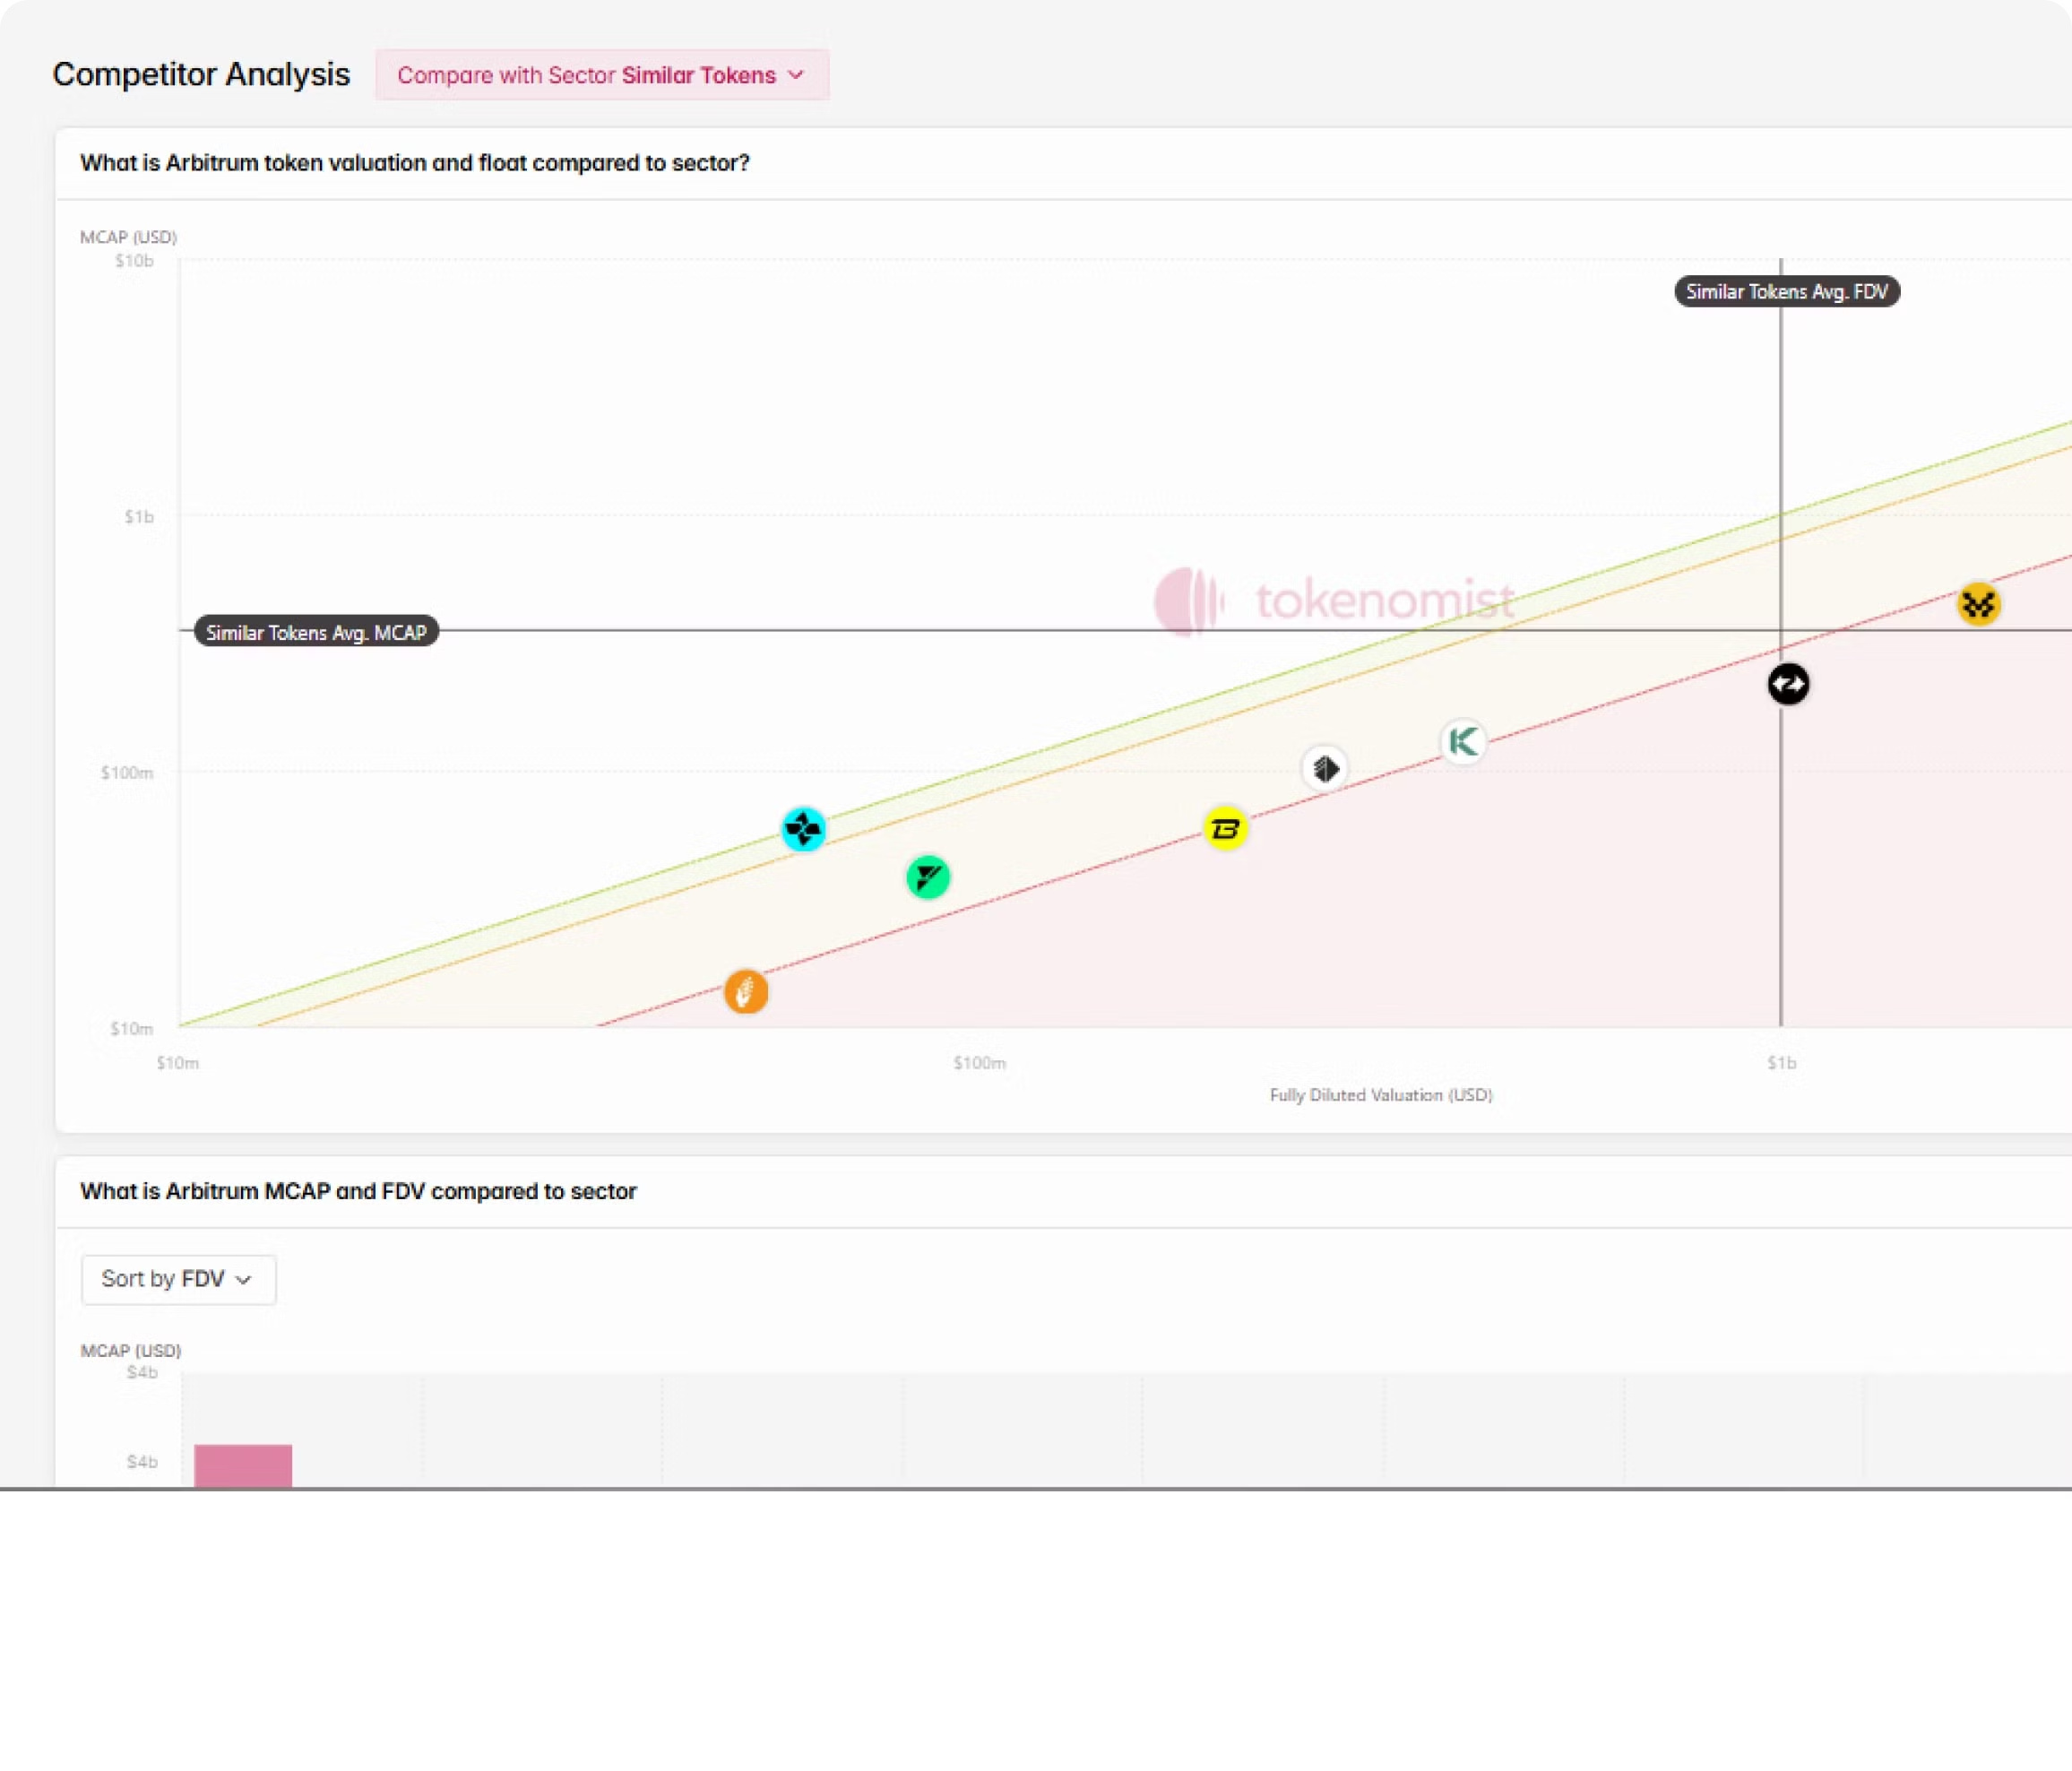
Competitor Analysis
What is token valuation and float compared to sector?
Loading...
What is MCAP and FDV compared to sector
Sort by
Loading...
Detailed Valuation

Tokenomist Research
Explore morePress & Mentions
See all press & mentionsTokenomist.ai provides a complete solution for supply-side tokenomics data. Analyze future token emissions, track vesting schedules, and compare standardized tokenomics and allocation across projects to gain actionable insights