

Price

Burn
--
Buyback
4.16%
Dynamic
No
Claim
--
Raise Amount
$18.50M
Version 1
Announced: 14 Nov 2024
Competitor Analysis
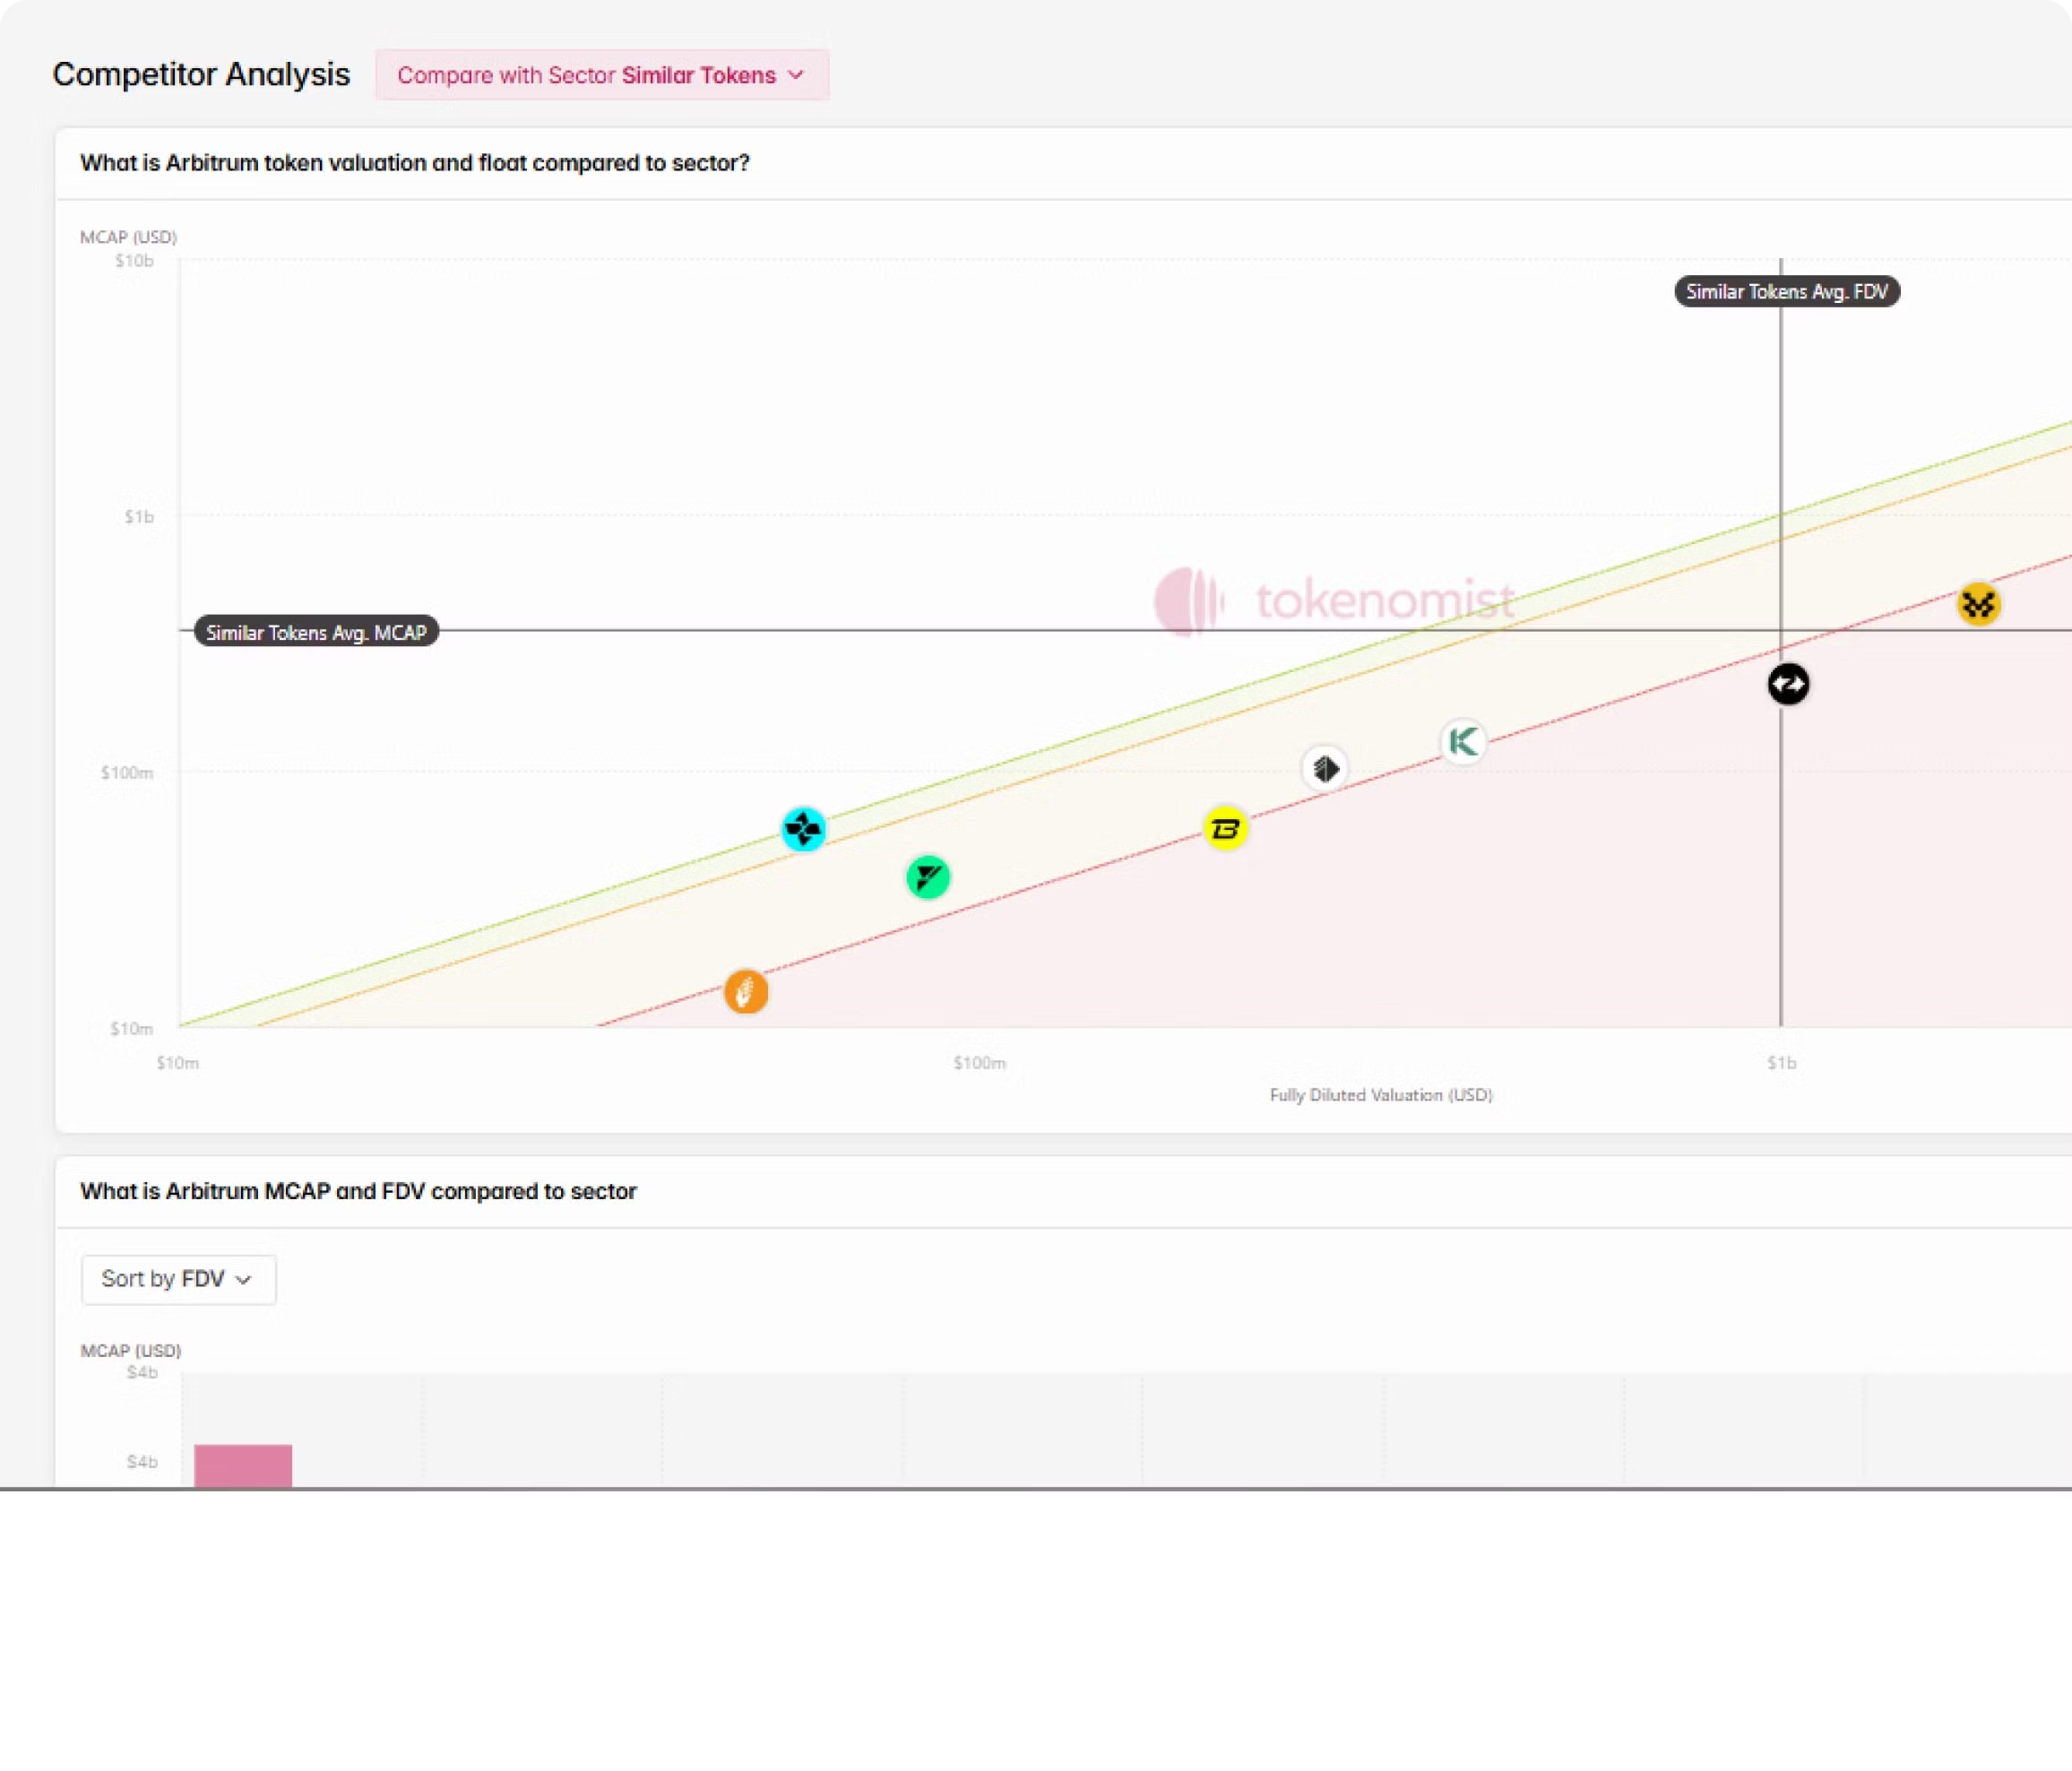
What is Usual token valuation and float compared to sector?
Loading...

What is Usual MCAP and FDV compared to sector
Sort by
Loading...
Detailed Valuation

Evaluate Tokens Against Competitors
Speed up your research game, get on Pro!
Compare to Sector or Similar Tokens
Low Float, High FDV Analysis
Token Valuation against Competitors
Ready to use Sector Average Metrics
Trending Tokens


Token Information
Last updated
What is the Usual token vesting schedule?
Usual follows a vesting schedule with allocations to the Community Incentives, Initial Airdrop, Binance Launchpool, DAO and Ecosystem, Investors & Advisors, Team and Liquidity. Most allocations are released through a cliff mechanism. The full unlock schedule extends into 2028.
When is the next Usual unlock?
Usual has no upcoming cliff unlock scheduled. 47.94% of the supply is still locked and will continue to be released according to the vesting schedule.
How much Usual supply is currently unlocked?
As of today, approximately 2,082,496,207 Usual has been unlocked, which is 52.06% of Usual’s total supply. Float is 52.06% of max supply (excluding burned tokens). The remaining tokens are still locked and will be released according to the vesting schedule.
Is Usual vesting cliff or linear?
Usual uses linear vesting, especially for Community Incentives allocations. This means tokens are released in equal amounts over time, reducing sudden supply shocks.
What is the difference between Usual circulating and total supply?
The circulating supply of Usual is 1,984,311,460 tokens, the total supply is 4,000,000,000 tokens, and the max supply is 4,000,000,000 tokens. The total supply is all tokens that have been or will be created, including those that are still locked. The max supply is the max amount of tokens to ever be in circulation. Since no Usual tokens have been burned, the max supply is equal to the total supply.
What is Usual's FDV (Fully Diluted Valuation)?
Usual’s FDV is $42,725,040 which reflects the market value if all 3,000,000,000 tokens were unlocked. This figure helps estimate long-term dilution risks.
How is Usual allocated across stakeholders?
The Usual allocation includes Investors & Advisors at 5.68%, Team at 4.32%, Liquidity at 2.00%, Community Incentives at 64.50%, Initial Airdrop at 8.50%, Binance Launchpool at 7.50% and DAO and Ecosystem at 7.50%.
Has Usual price dropped after past unlocks?
Historically, Usual has shown high volatility 7 days after the past unlock. The price impact depends on who receives the unlocked tokens and market conditions.
How can I track upcoming Usual unlocks?
Tokenomist provides an up-to-date vesting chart and unlocks monitor that shows upcoming unlocks for Usual, with visibility for each allocation and amount.
Tokenomist Research
Explore moreWhat the Market Does Around a Token Unlock
Across 846 unlocks from 2022 to 2026, the market changed before and after the date more than on it. Ahead of the biggest unlocks, the short side of the futures market paid more often to stay in. In the week after, price momentum faded. Market data through November 2, 2026.


Nov 17, 2026
16 min read

Chawapat Peechapat · Nov 17, 2026
What the Market Does Around a Token Unlock
Weekly Unlock Digest: Nov 16–22, 2026 | LayerZero's $34.69M Cliff Lands Ahead of Zero Mainnet
LayerZero's $34.69M ZRO cliff (5.82% of circulating supply) headlines over $113M in scheduled unlocks, after a week of a 13–14% Bitcoin drop, Predict.fun's TGE restart, Allora's six-month cliff delay and Katana's buyback plan.


Nov 16, 2026
7 min read

ali3nblue · Nov 16, 2026
Weekly Unlock Digest: Nov 16–22, 2026 | LayerZero's $34.69M Cliff Lands Ahead of Zero Mainnet




Tokenomist.ai provides a complete solution for supply-side tokenomics data. Analyze future token emissions, track vesting schedules, and compare standardized tokenomics and allocation across projects to gain actionable insights