Price
Burn
--
Buyback
--
Dynamic
No
Claim
--
Raise Amount
$6.22M
Version 1
Updated: 09 Oct 2025
Notable Release Event
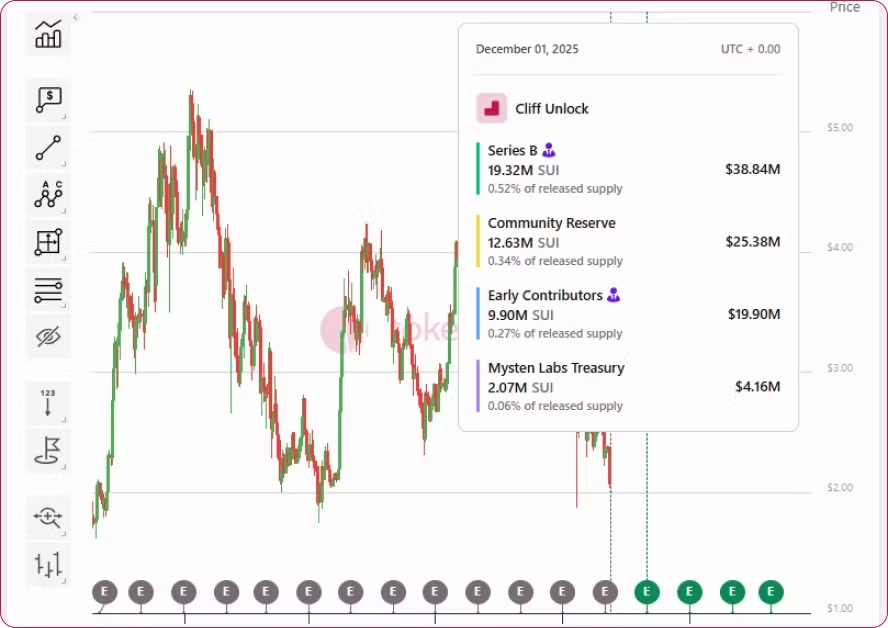
Notable Cliff Release Events
Token release event data is provided for informational purposes only. Actual release times and amounts may vary.
Want to integrate this data?
Explore our APITokenomist Research
Explore morePress & Mentions
See all press & mentionsTokenomist.ai provides a complete solution for supply-side tokenomics data. Analyze future token emissions, track vesting schedules, and compare standardized tokenomics and allocation across projects to gain actionable insights