How to Read the Market Maker Performance Index

PARTNERSHIP FEATURE
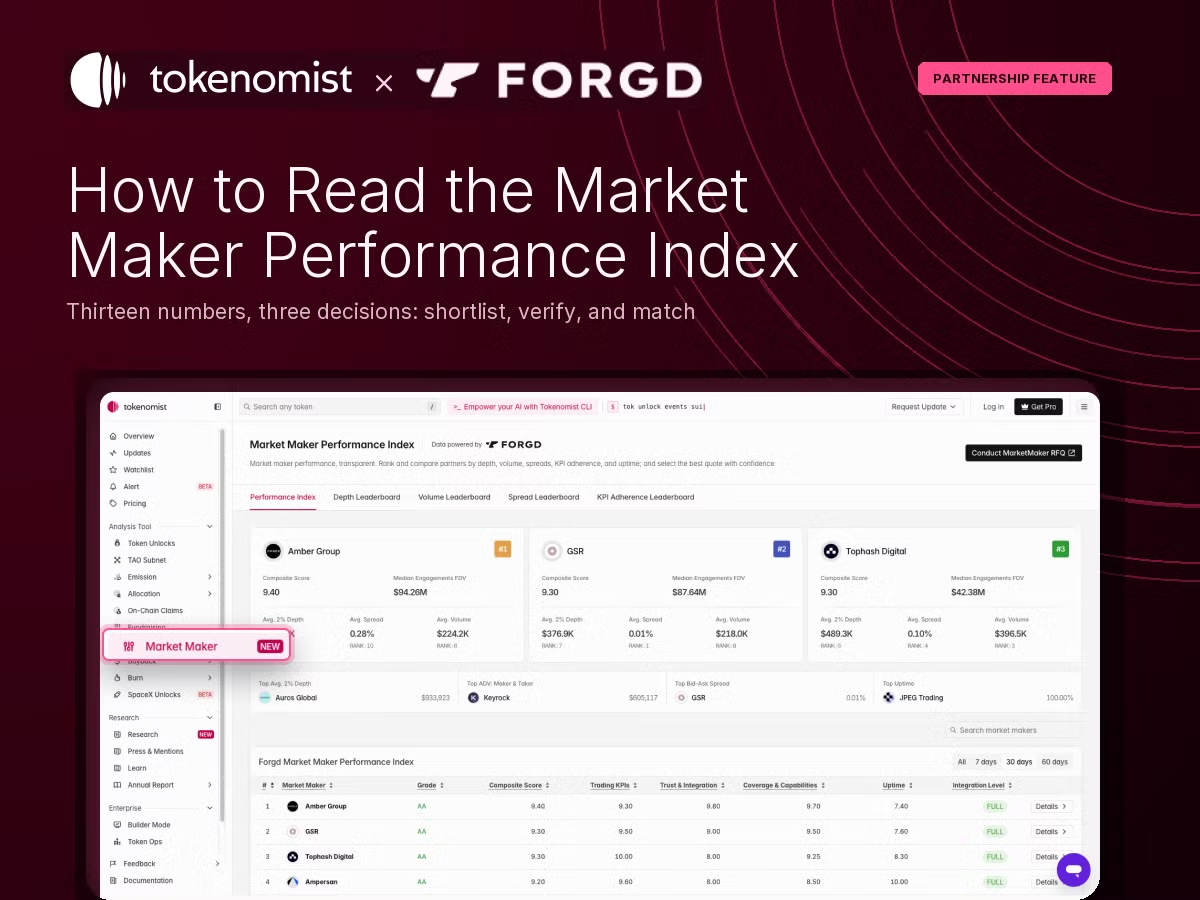
The Forgd Market Maker Performance Index is now live on Tokenomist. 49 market maker firms, graded on tracked engagement data rather than on pitch decks, free to read and open to anyone. See the index.
Ask any of those 49 firms for references and you will get references. Ask for performance data and you will get a deck. Market making has run on self-reported claims for its entire history, and self-reported claims converge on one shape: every firm is top tier, every firm has deep exchange relationships, every firm's clients are happy.
A market maker's job comes down to three numbers: spread, depth and uptime. Each is defined below at the point it starts to matter, so no background is needed.
This piece walks the leaderboard in the order the screens let you work: scan every firm at once on the main table, check what the tracked ones actually did on the Depth Leaderboard, then open the panel on the few still standing to see which fits your token.
Every figure below is read straight from the published leaderboard on 2026-08-17, on the 30-day view, and is free for anyone to check. Switch the period and the numbers change, including which firm sits at the top. Firms are named in the charts and screenshots exactly as the board names them. The underlying engagement data is supplied by Forgd.
Key Takeaways
- Half the index cannot be checked at all. 25 of the 49 firms are not connected to any tracking, so they carry no execution record. A low grade there means unmeasured, not bad.
- Uptime is the most revealing metric and the one the composite score hides. Across the 16 firms with uptime recorded, it runs from 100.00% down to 9.24%.
- Among the firms that agreed to be tracked, the median depth loan utilization is 59.06%: a typical one posts under three fifths of the inventory you lend it.
- None of it tells you the price. That is still negotiated, just with far better information.
Where the data comes from
Market maker performance does not exist in public by default. There is no filing requirement and no regulator collecting it, and a market making agreement is a private contract seen only by the two parties who signed it.
Forgd integrates directly with market maker firms, which connect their trading systems and share their engagement data, and it records what each engagement did: how much size was resting in the book, at what spread, on which venues, and for what share of the time. The scores here come from more than 500 tracked engagements, and its own about page reports more than 1,000 projects and advisors sharing data, more than 30 market makers in its request-for-quote process, and more than $90B of market value across the projects it has worked with.
One founder sees one contract. Forgd sees hundreds, in a standard shape, which is what makes comparison possible. Forgd supplies the tracked data; Tokenomist publishes it beside the supply-side data we already carry, so you can see what is unlocking and who is holding the book in one place.
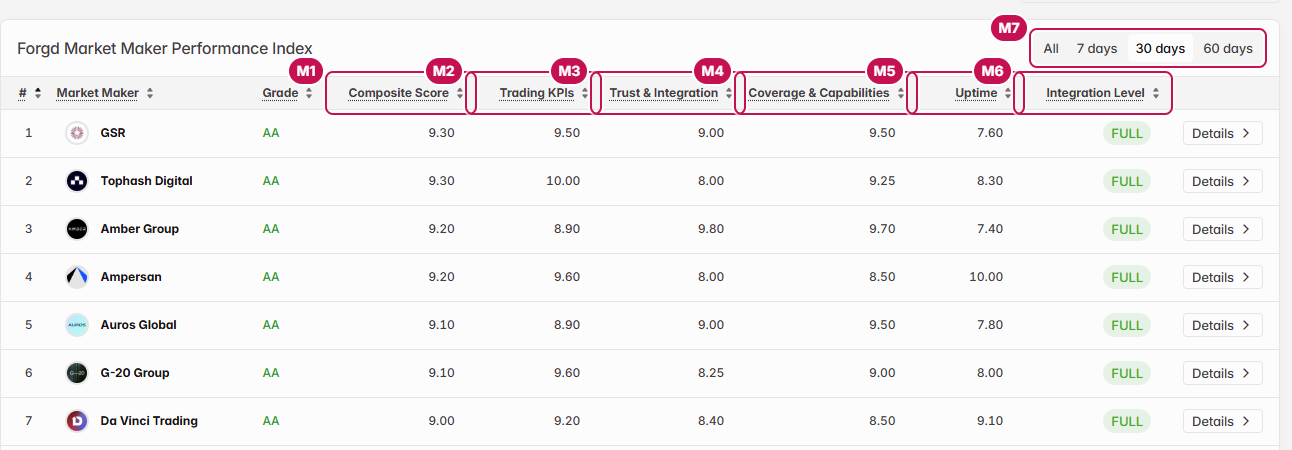
Three screens, three maps. The whole product is three surfaces: the main table, the Depth Leaderboard and the per-firm detail panel. Each is mapped once below, and every metric carries a code whose letter names its surface: M for the main table, D for the Depth Leaderboard, P for the detail panel. So M6 is the sixth callout on the main table, D2 the second on the Depth Leaderboard. Codes appear in brackets at the first mention of each metric, and the cheat sheet at the end doubles as a legend for all three maps.
One habit before you start. Every figure below can be read across 7 days, 30 days, 60 days or all tracked history, and the toggle sits above the table (M7). A firm that holds its position across all four is a different proposition from one having a good month, so switch the period on anything that matters.
Step 1: Shortlist
Two columns exist to cut the list fast, and both sit on the main table, where all 49 firms are visible at once. Use them for that, then stop using them.
Integration Level: can this firm be checked at all?
Market maker performance only becomes visible if the firm connects its trading systems and exchange accounts so an outside party can observe them. Integration Level says whether it has (M6). It reads FULL, PARTIAL or NONE.
All 24 firms carrying a composite score are fully integrated. That is not a coincidence, it is the mechanism. The other 25 show a dash where their trading and uptime scores should be: nine are partially connected, 16 not at all.
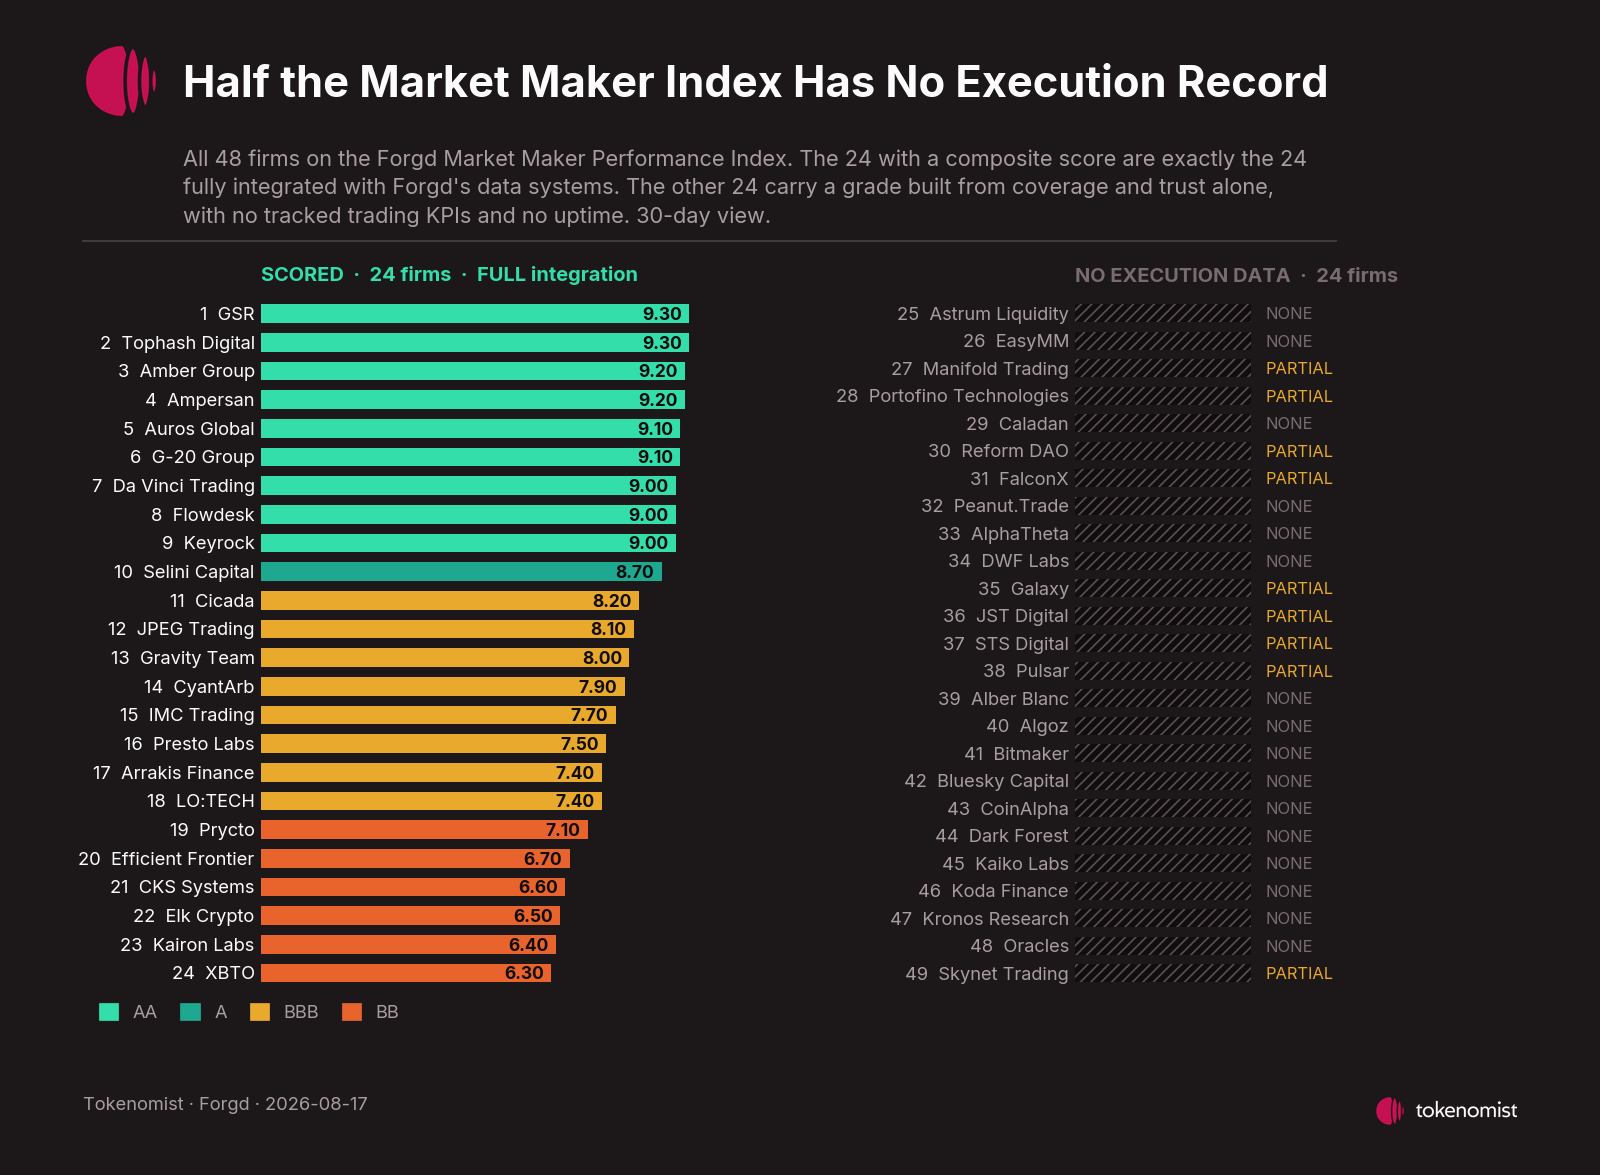
A dash is not evidence of poor performance: a firm with no tracked record might be excellent and simply not plugged in. It does mean you have nothing to check, and are back to trusting the deck. Willingness to be measured is itself information, so ask why. It also means the 24 you can check are the 24 that agreed to be checked. Read their spread as the measured half of the industry rather than the whole of it, which makes the low readings on it more striking rather than less.
Composite Score: a filter, not an answer
One number out of 10 blending the five dimensions (M1), driving the letter grade beside it, and the board is sorted by it out of the box. Grades run AA, A, BBB, BB and CCC, in the manner of credit ratings, though they are explicitly not credit ratings.
It gets you from 49 firms to a handful, and it does that well. What it cannot do is choose between them, for two reasons: the weights behind the blend are not published, and it averages away the dimension that decides how your token trades on a bad day. A firm sitting near the top of the board carries a 9.20 composite built from 9.80, 9.70 and 8.90 on three of its dimensions and 7.40 on uptime. A 2.4-point spread collapses into one number, and the dimension it averages away is the one you most needed to see.
End of Step 1. You should now have a handful of fully integrated firms with respectable composites. Everything below is about interrogating them.
Step 2: Verify
Now interrogate each shortlisted firm's track record, hardest question first.
Uptime: were the orders there on the bad day?
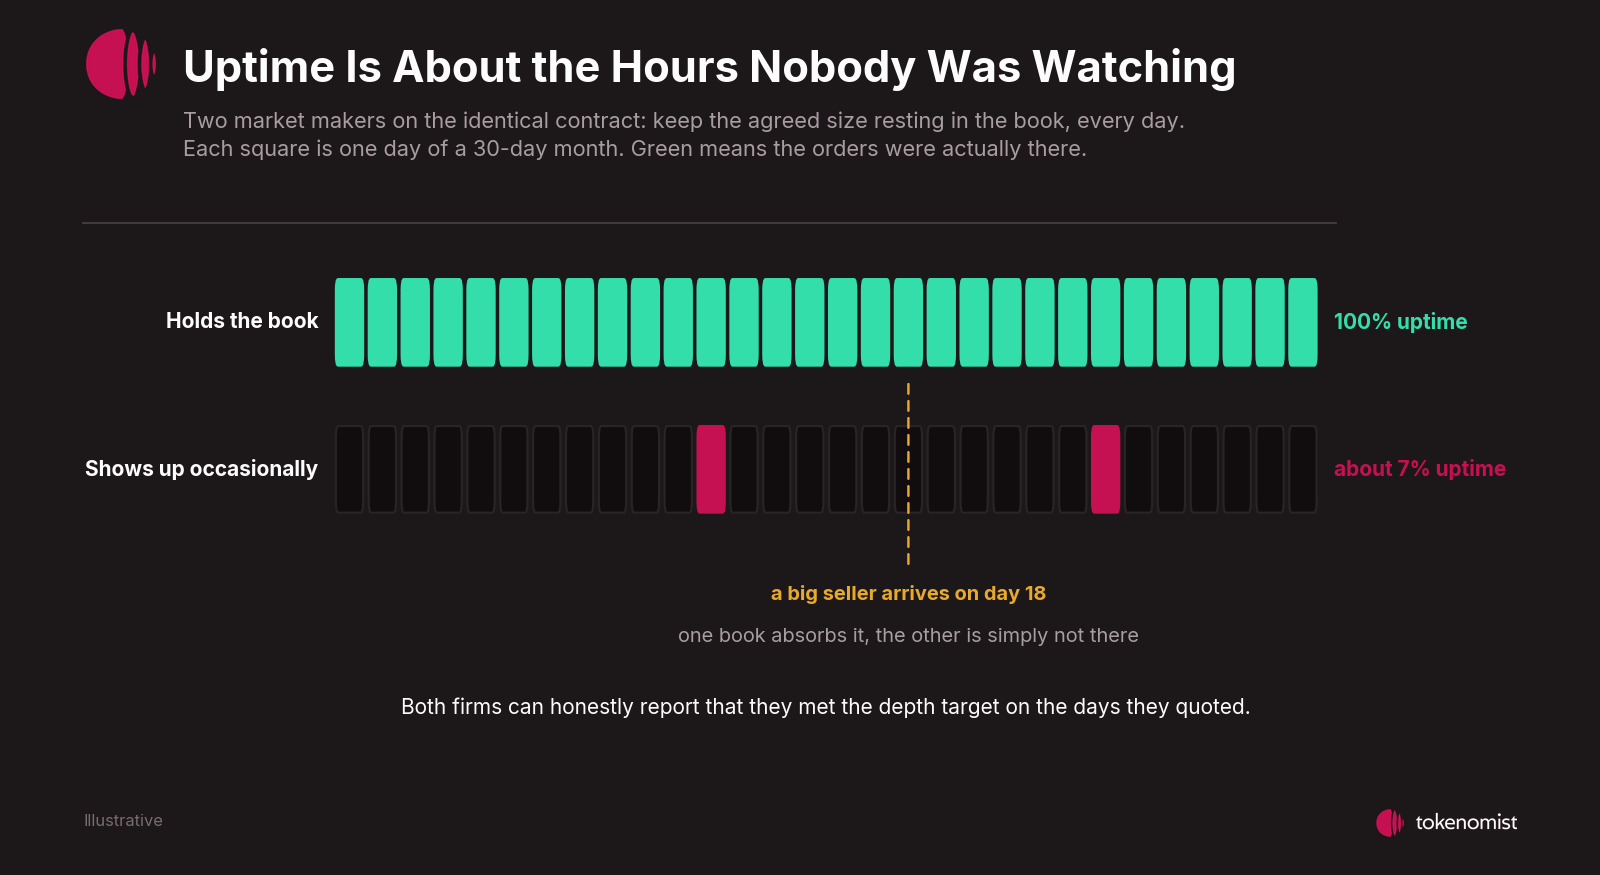
A contract sets targets: keep this much size resting within this distance of the price, on these venues, continuously. Uptime is the share of the period the firm actually did it. Nothing to do with servers.
Picture a firm contracted to keep $200,000 of orders in your book at all times, delivering that for three days a month. On those three days your spread looks excellent. On the other twenty-seven, a seller arrives and finds nothing there.
Two uptime readings, and they are not the same
The Uptime column on the main table (M5) is a 0 to 10 score covering contractual consistency broadly. The Uptime % column on the Depth Leaderboard (D2) is a percentage, answering the narrower question: of all the hours in the period, what share did this firm have its agreed depth actually sitting in the book?
They are related, can diverge sharply for the same firm, and neither is a proxy for the other. Read both.
Sixteen of the 24 fully integrated firms have an uptime percentage recorded. Uptime % measures time spent holding a depth target, so it exists only where there is a tracked depth engagement to measure against: six of the eight without one do not appear on the Depth Leaderboard at all, and two appear there with no uptime figure. Full integration means the connection is open, not that an engagement is running through it. Across those 16, three sit at exactly 100.00%. The lowest reads 9.24% and the next lowest 12.08%, which over a 30-day month is under three days and about three and a half days of actually holding the book.
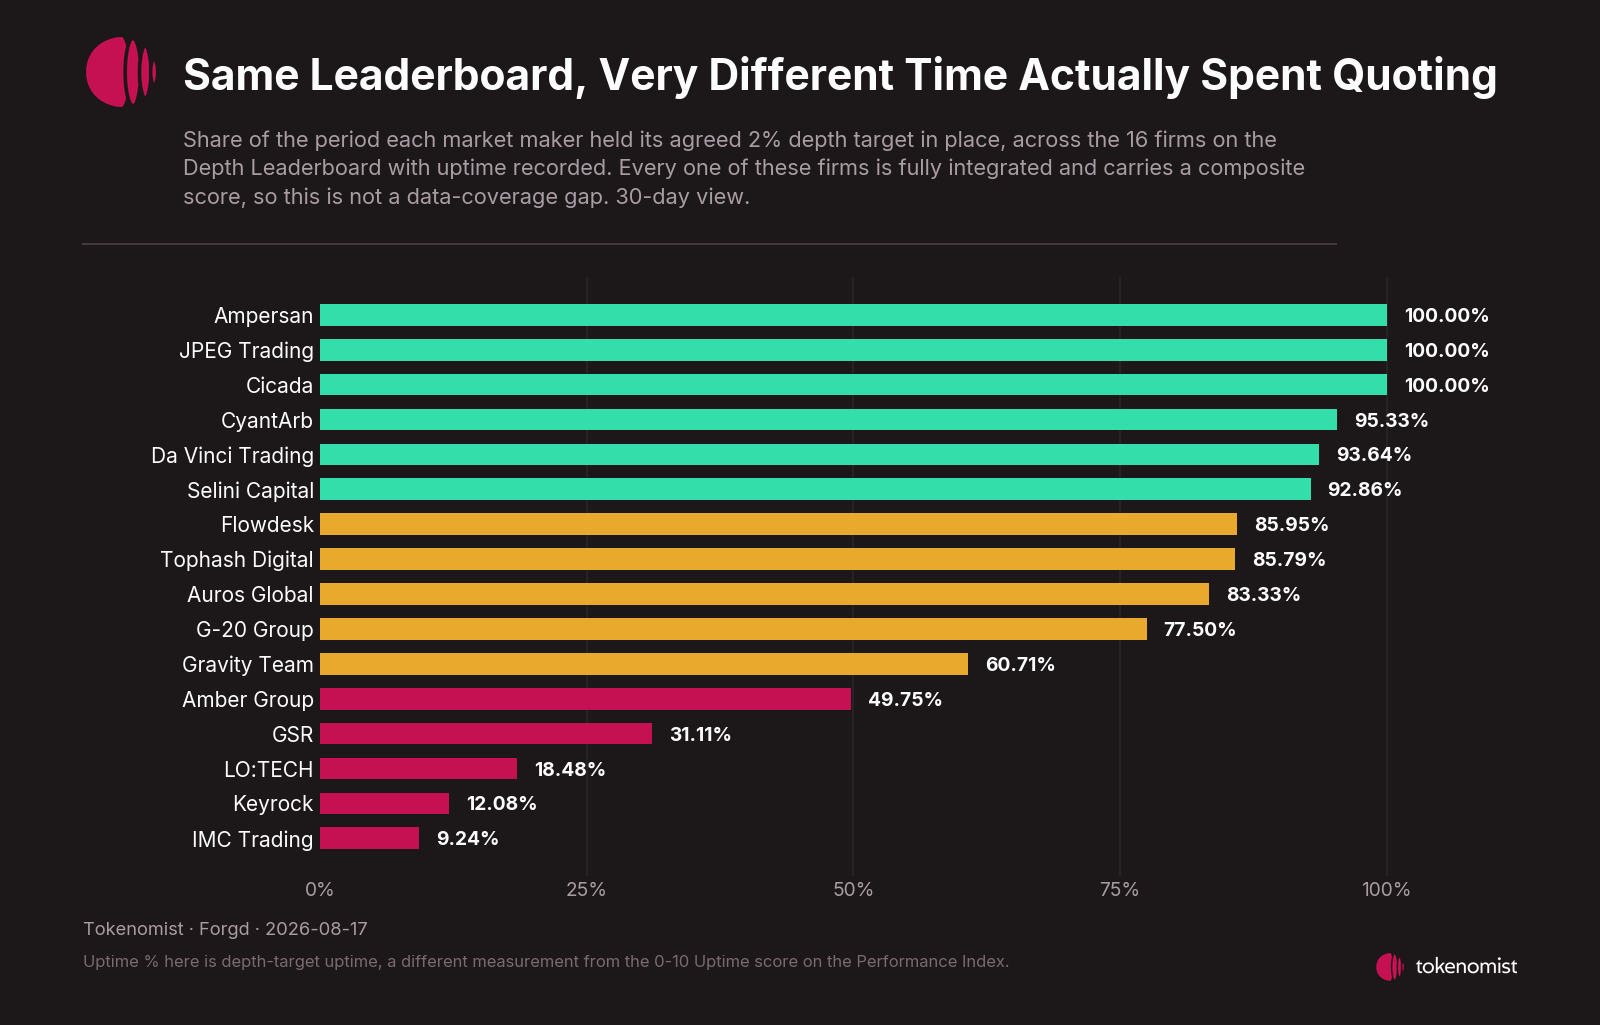
One fair caveat: this measures each firm against its own targets across its own engagements. You cannot see the contract behind it, and a low figure might reflect a mandate that never required continuous quoting.
Red flag: a percentage low enough to mean whole weeks unattended, like the readings at the bottom of the board. Ask what the mandate actually required before you conclude anything, but ask.
Trading KPIs: the grade on the work itself
Out of 10 (M2), built from more than 500 tracked engagements. Four inputs: whether the firm kept enough money resting in the book, whether it kept the buy-sell gap tight, whether real trading happened, and whether it met the obligations it agreed to.
Every other column describes the firm's setup. This is the only one grading the work, so read it first among the five, and alongside uptime rather than instead of it: a strong score here with weak uptime describes a firm that performs well when it is present.
Red flag: a strong Trading KPI score paired with a weak uptime reading, sold to you as simply "strong execution".
Trust & Integration: how much has actually been seen
Out of 10 (M3). Despite the name it is not a judgement of honesty. It reflects how much of the firm's activity has been observed, and whether anything in it looked irregular.
A score built on two engagements and one built on fifty are not the same claim even when the number matches, so a low reading here often means a short history rather than a bad one. Tracked history is itself an input, so the top scores tend to belong to the earliest integrators.
Red flag: treating this as a character reference in either direction.
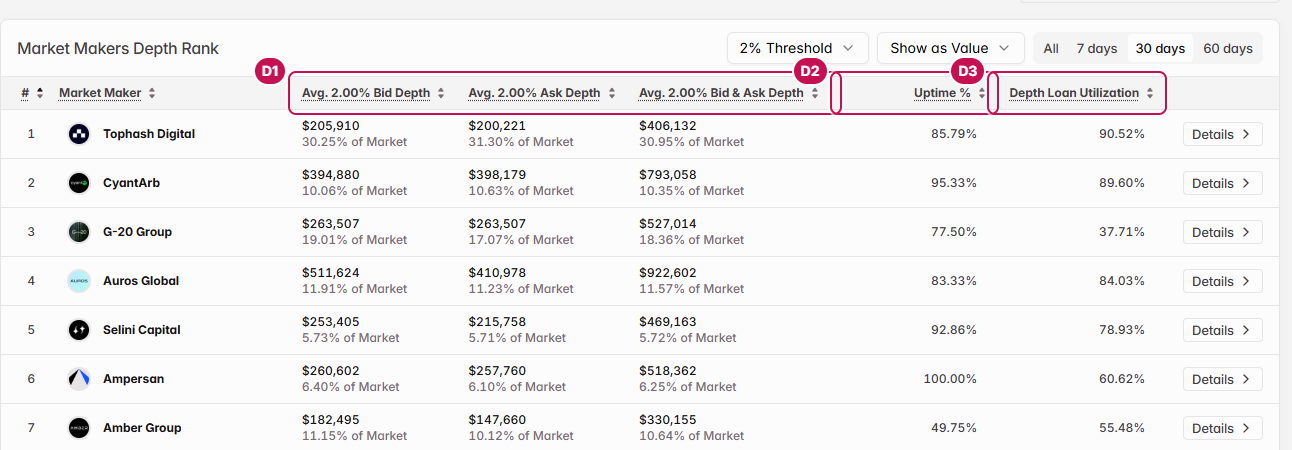
The next four metrics all live on this second screen.
2% Bid and Ask Depth: what a big sell actually costs
The mid price is the midpoint between the best buy and best sell offer. 2% depth counts every resting order within 2% either side of it (D1). Two percent is a convention for close enough to matter.
It splits in two. Bid depth is the money waiting below the price, the cushion that catches selling. Ask depth is what stops the price spiking when somebody buys.
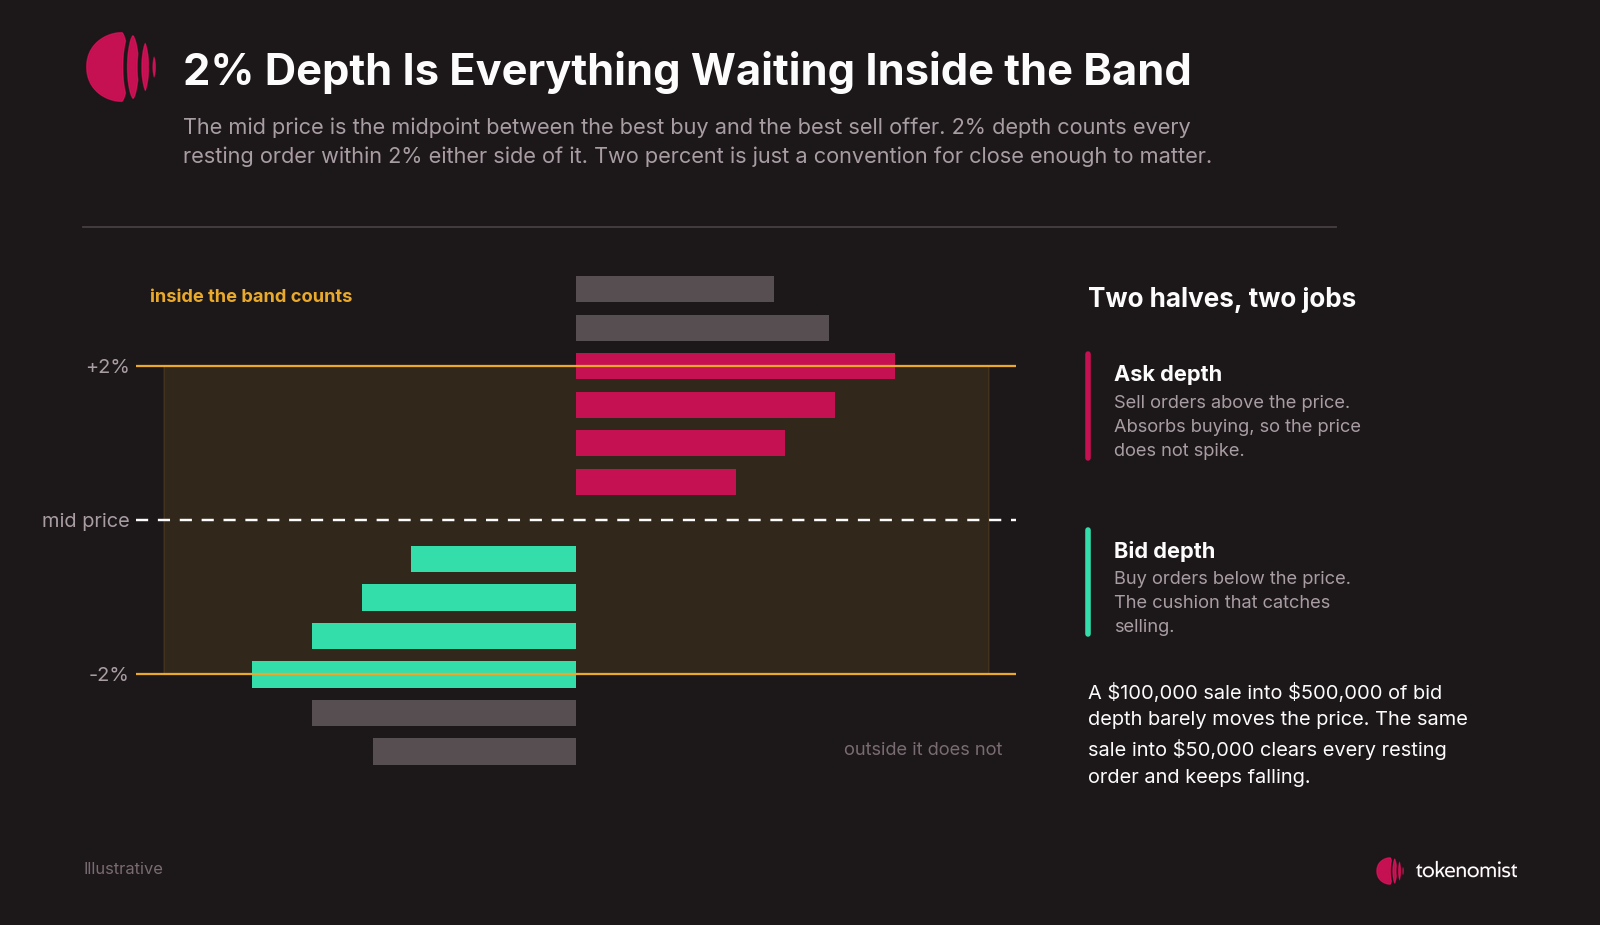
Judge it against the trades your holders actually place. A $100,000 sale into $500,000 of bid depth barely moves the price. The same sale into $50,000 clears every resting order and keeps falling, because there is nothing left to catch it. The largest combined 2% depth on the board averages around $923,000.
Red flag: depth that looks adequate until you compare it to the size your own holders trade in.
Bid and ask balance: which way the price moves more easily
A healthy book holds roughly as much below the price as above it. When the buy side is thinner, it takes less selling to push the price down than buying to push it up, so the token drifts downward on ordinary flow. The bid and ask columns sit side by side on the Depth Leaderboard (D1), and the panel splits the same comparison by band (P1).
Across the 18 firms publishing both sides, the median ratio of bid to ask depth is 1.02, about as even as it gets, and seven sit inside 0.9 to 1.1. Four run thinner on the bid side. The most lopsided reads 0.55: barely half as much money catching sellers as capping buyers.
Red flag: a ratio materially below 1.0, in the region of the 0.55 outlier on the board.
Depth Loan Utilization: are the tokens you lent working?
Most engagements involve lending the firm tokens to quote with. They leave your treasury and you carry the risk the whole time, whether or not they ever reach the book. Utilization is the share actually posted as resting orders (D3).
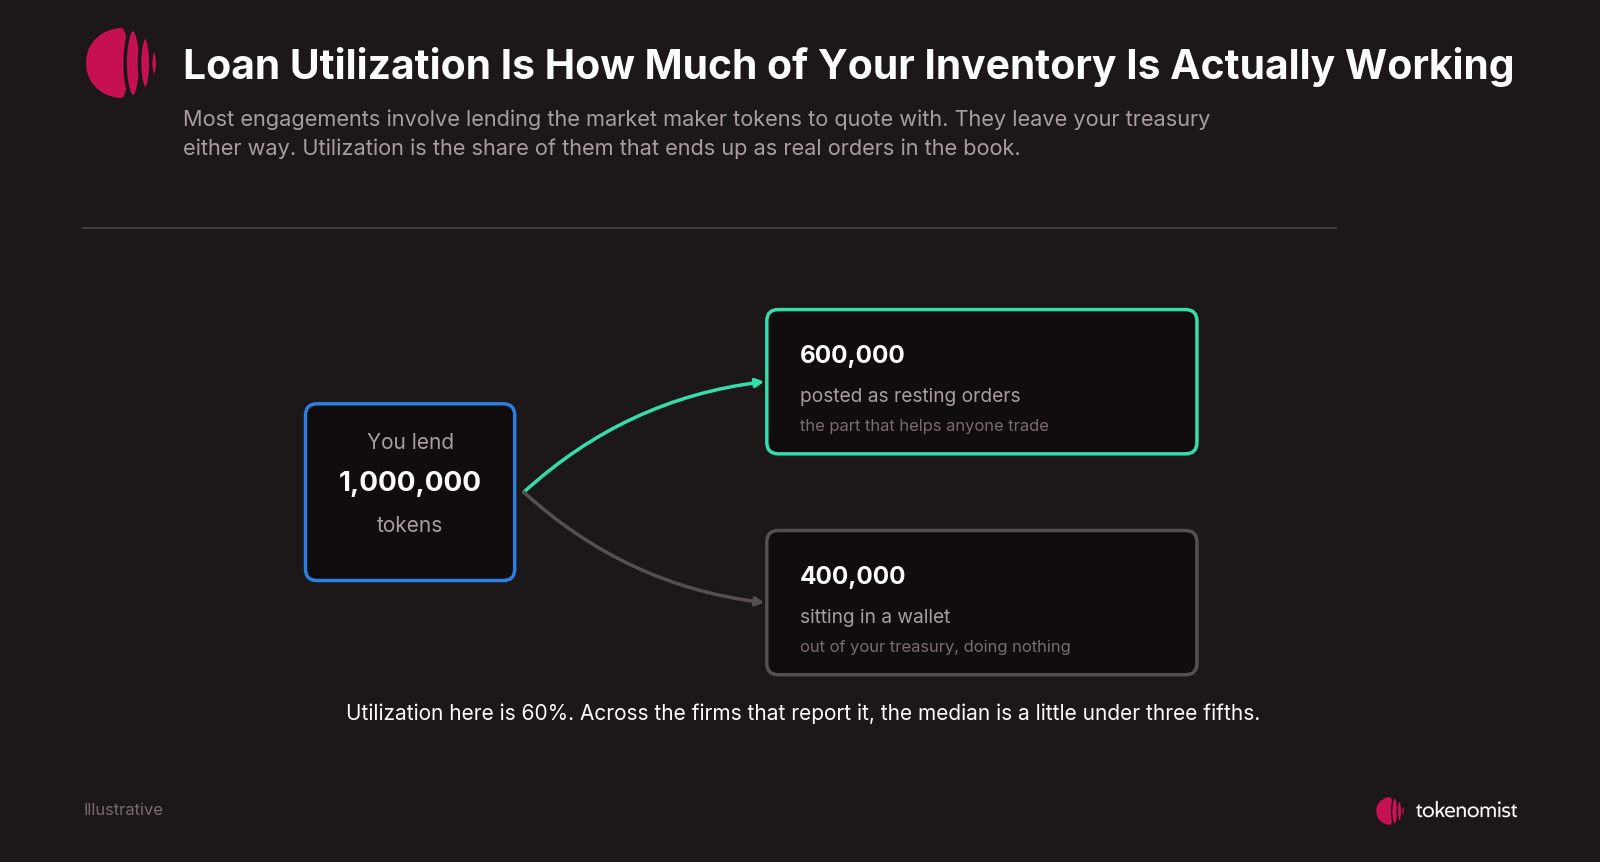
The highest reading on the board is 90.52%. Above 100% would mean a firm quoting past the loan with its own capital, which is the best version of this. The lowest three read 24.51%, 8.00% and 4.94%: a firm at 4.94% borrowed your inventory and deployed one-twentieth of it. The median across the 17 firms reporting it is 59.06%.
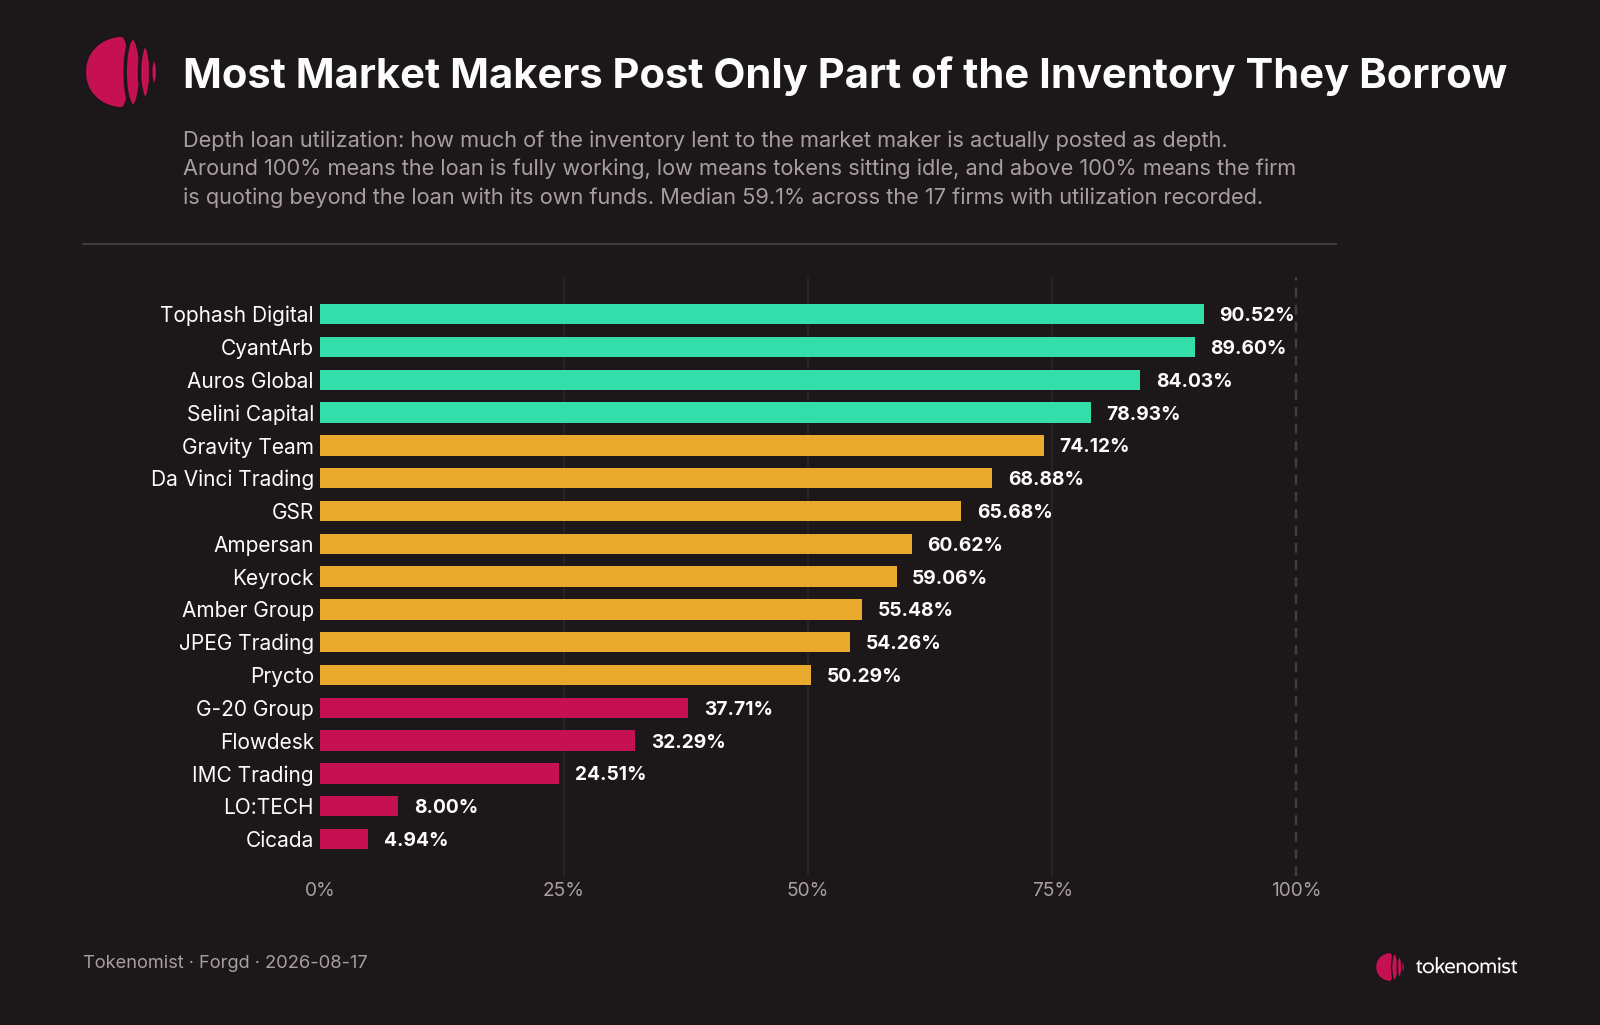
This is the cleanest early-warning signal in the whole dataset, because it is hard to explain away.
Red flag: utilization well below the 59.06% median, and no answer for why.
Step 3: Match
Everything so far ranks firms in the abstract. This step is about fit. All of it lives in the per-firm panel, which opens one firm at a time, and that is the only reason it comes last: a firm that cannot quote where your token trades is no use to you at any score, but you were never going to open 49 panels to find out.
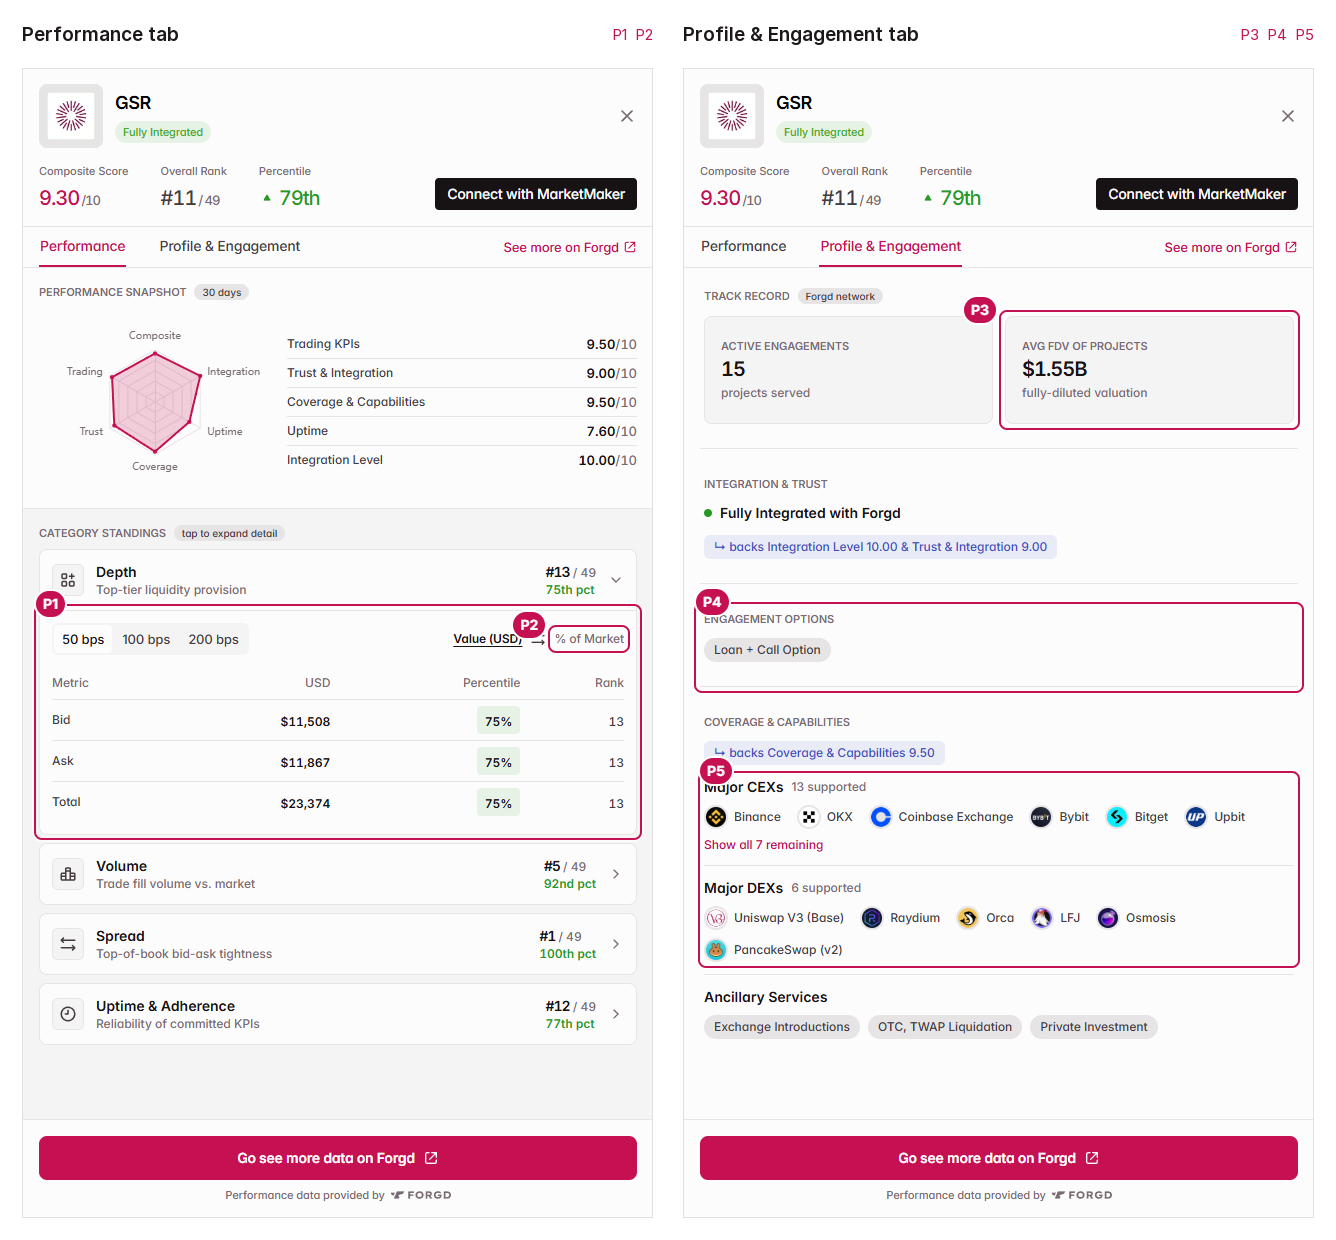
Major CEXs and DEXs: turning a score into a yes or no
Coverage & Capabilities (M4) gives you a score out of 10, which is useful for ranking and useless for the only question you have: can this firm quote your token where it already trades, or where you are trying to list next?
The Profile & Engagement tab answers it directly (P5), listing the venues by name, plus Ancillary Services for anything beyond liquidity.
% of Market: carrying the token, or a bit player
The same dollar figure means two different things depending on the book it sits in. $250,000 that is a third of everything available means the firm is carrying the token; the same $250,000 at 2% makes it a minor participant.
Across the board, firms range from 1.51% to 30.95% of market on combined depth. The largest single combined 2% depth is $922,602, which is 11.57% of that token's book. Which end you want depends entirely on what you are hiring for, which is why it is shown rather than scored. In the panel it is the toggle beside Value (USD) (P2), and the Depth Leaderboard prints the same share under every dollar figure (D1).
Median Engagements FDV: has it done a token your size?
The typical size of token the firm works with, by fully diluted valuation, shown on each firm's card. Quoting a $1B token and quoting a $30M token are different jobs: different venues, different order sizes, different amounts of capital at risk, different amounts of attention from the desk.
A firm whose typical client dwarfs you may sign you then deprioritise you; one that has never worked above your size may not have the balance sheet. Compare against your own fully diluted valuation, not your market cap, because that is what the metric uses. The panel carries a near relation (P3), the average FDV across that firm's projects rather than the median.
Engagement Options: cheap now, expensive if you succeed
How you pay is often a bigger decision than who you hire, and it is the one most easily got wrong.
Two normal structures. A monthly retainer, where you pay cash and lend inventory separately. Or a loan and call option, where you lend tokens and the firm receives the right to buy some of them later at a fixed price. The second costs nothing up front, which is exactly why it gets mispriced.
Take an option on 1,000,000 tokens struck at $0.12, against a $20,000 monthly retainer:
- Token stalls at $0.10. The option expires worthless. You paid nothing, where the retainer would have cost $240,000.
- Token reaches $0.30. The option is worth $180,000, still less than the retainer.
- Token reaches $0.60. The option is worth $480,000. Twice the retainer, for identical work.
The two cost the same at $0.36. Above that, every extra cent on your token hands the firm another $10,000.
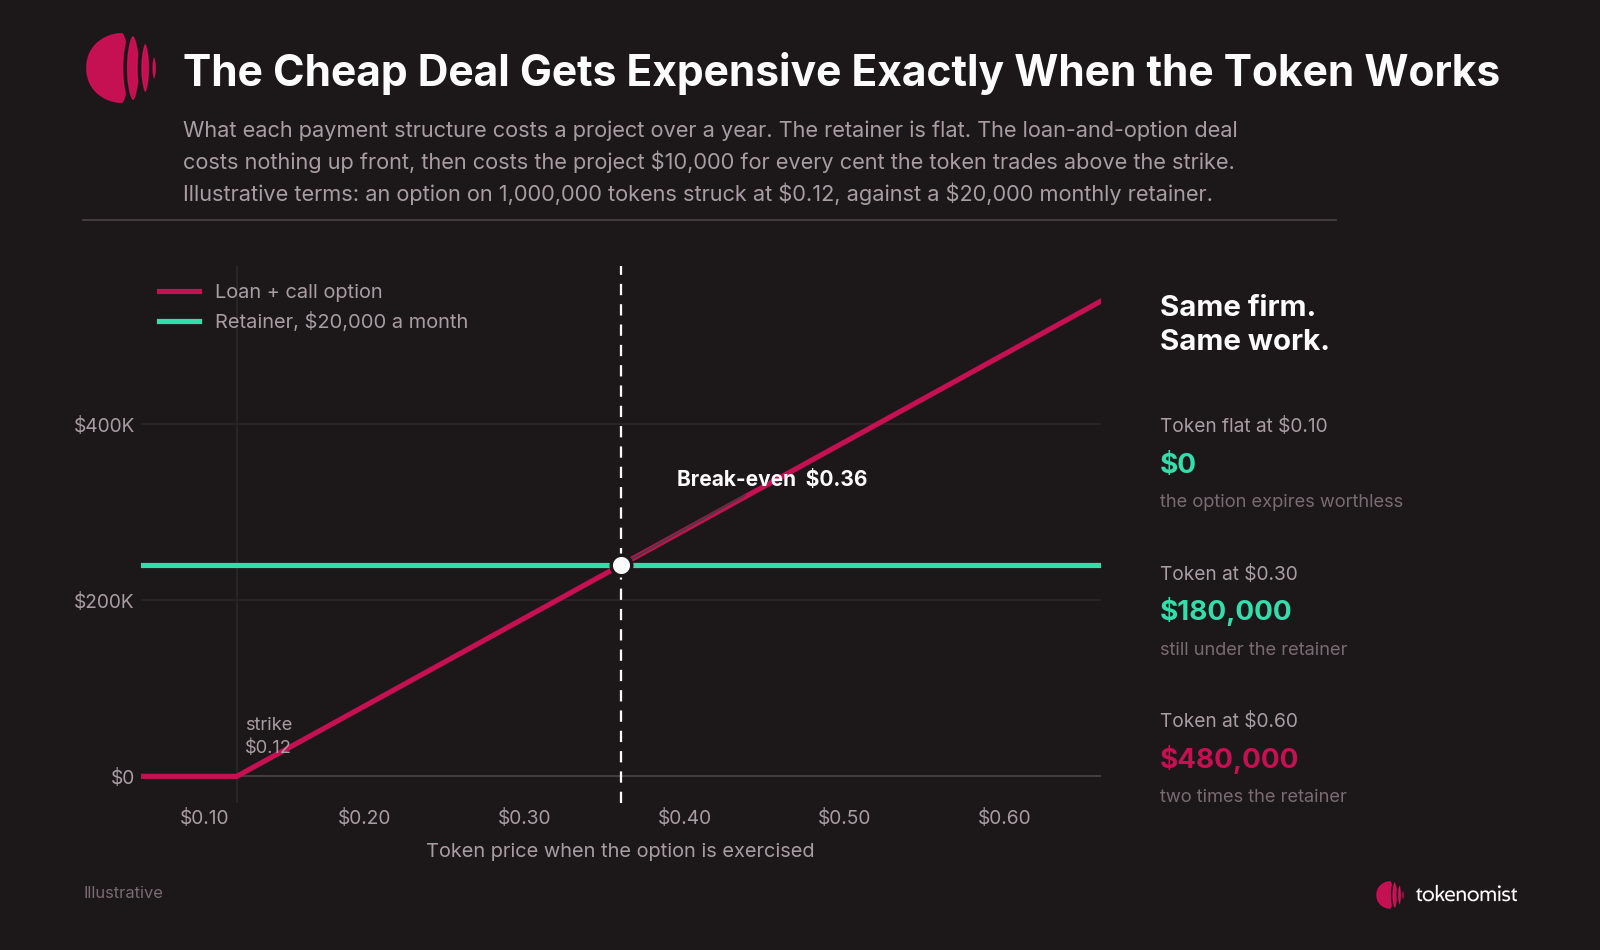
Neither structure is wrong: paying with upside instead of cash is often right for a team that has tokens and no cash. The mistake is signing without doing that arithmetic. The panel tells you which structures a firm works under before you spend a call finding out (P4).
Red flag: an option-based deal presented as free because nothing is due at signing, with no strike price and no token count you can run the arithmetic on.
From shortlist to signed contract
The index scores how firms perform, not what they charge. Price is negotiated per engagement, and it is the one thing you still run yourself.
What everything above changes is the shape of that negotiation: instead of comparing four proposals against each other, you compare each against what that firm has actually done. Send one structured request to several firms at once, so every bid answers the same requirements and each can be read next to its own record.
Then put the numbers you agreed into the contract, uptime included.
See the index: open the leaderboard
Cheat sheet
| Metric | The question it answers | What good looks like | Where it lives |
|---|---|---|---|
| Integration Level | Can this firm be checked at all? | FULL. Only fully integrated firms carry an execution record | Main table (M6) |
| Composite Score | Who belongs on the shortlist? | High, but used to cut the list, not to pick the winner | Main table (M1) |
| Uptime (score) | Was it consistent on its obligations? | High, and read next to the percentage | Main table (M5) |
| Uptime % | What share of hours was the depth actually there? | Near 100%. The board runs from 100.00% down to 9.24% | Depth Leaderboard (D2) |
| Trading KPIs | How good is the work itself? | High, read alongside uptime, never instead of it | Main table (M2) |
| Trust & Integration | How much has actually been observed? | High, but a low score often means a short history | Main table (M3) |
| 2% Bid and Ask Depth | What does a big sell cost? | Sized against your holders' real trades | Depth Leaderboard (D1) |
| Bid and ask balance | Which way does the price move more easily? | Near 1.0. Median on the board is 1.02 | Depth Leaderboard (D1) |
| Depth Loan Utilization | Are the tokens you lent working? | Near 100%. Median is 59.06% | Depth Leaderboard (D3) |
| Major CEXs and DEXs | Can it quote where your token trades? | Your venues, present by name | Detail panel (P5) |
| % of Market | Carrying the token, or a bit player? | Depends what you are hiring for. Range 1.51% to 30.95% | Detail panel (P2) |
| Median Engagements FDV | Has it done a token your size? | Near your own fully diluted valuation | Firm card for the median; panel (P3) for the average |
| Engagement Options | How do you pay, and what does it cost later? | A structure you can afford, priced before signing | Detail panel (P4) |
Frequently asked questions
What is the single most important metric?
Uptime. Every other number assumes the quotes existed, and excellent depth and spread for a fraction of the month is not the service you are paying for. Read it on its own, never through the composite.
How is the Uptime score different from the Uptime % on the Depth Leaderboard?
The main table's Uptime column is a 0 to 10 score covering contractual consistency across tracked engagements. The Depth Leaderboard shows a percentage specific to holding the agreed depth target. Related, not the same, and not directly comparable. Read both.
Does a low grade mean a firm is bad?
No. Half the listed firms have no execution record because they are not connected to any tracking, so their grade reflects missing data rather than measured performance. Treat it as a question for the call.
Are these grades credit ratings?
No. They are performance assessments based on observed and reported engagement data. They are not credit ratings and are not investment advice. The index itself is free: the leaderboard, the four specialised leaderboards and the per-firm detail panels are all on tokenomist.ai and need no account.
Sources
- Market maker scores, grades, depth, uptime, loan utilization and category leaders: Tokenomist Market Maker Performance Index and Depth Leaderboard, data powered by Forgd. Captured 2026-08-17 on the 30-day view.
- Metric definitions are Forgd's, condensed from the definitions published beneath each leaderboard.
- Forgd company description: forgd.com/about, read 2026-08-17.
Method
- Every figure quoted comes from the index itself. Scores move as new engagement data arrives, so treat each one as a reading on that date rather than a constant.
- Counts of scored versus unscored firms, and of integration levels, are our own tally of the published table. The bid-versus-ask comparison uses the separate bid and ask depth columns on the Depth Leaderboard, across the 18 firms that publish both.
- The three annotated screenshots are maps of the three surfaces the product has, captured live. Callout codes carry their surface as a letter: M for the main table, D for the Depth Leaderboard, P for the detail panel, and they appear in brackets at the first mention of each metric. Map 3 shows the panel's two tabs side by side because its metrics are split across both. The codes are ours; nothing on the live site is labelled this way.
- Diagrams marked Illustrative carry no real data. They exist to make a definition visible, and the measured version follows immediately after each one.
- Firms are named as they appear on the public leaderboard. Readings describe what was observed across each firm's own tracked engagements; the contracts behind them are private, so a low number is a reason to ask a question rather than a conclusion about a firm.
Grades are performance assessments based on observed and reported engagement data. They are not credit ratings and are not investment advice.
Recommend Article