Why Tokenomics Matters, Part 1

Tokenomics is the set of rules for how many tokens exist, who holds them and when the rest arrive. Those rules decide how large a share your tokens are today and how much that share can shrink later. This part teaches how to read them, starting with how supply is counted.
Key Takeaways
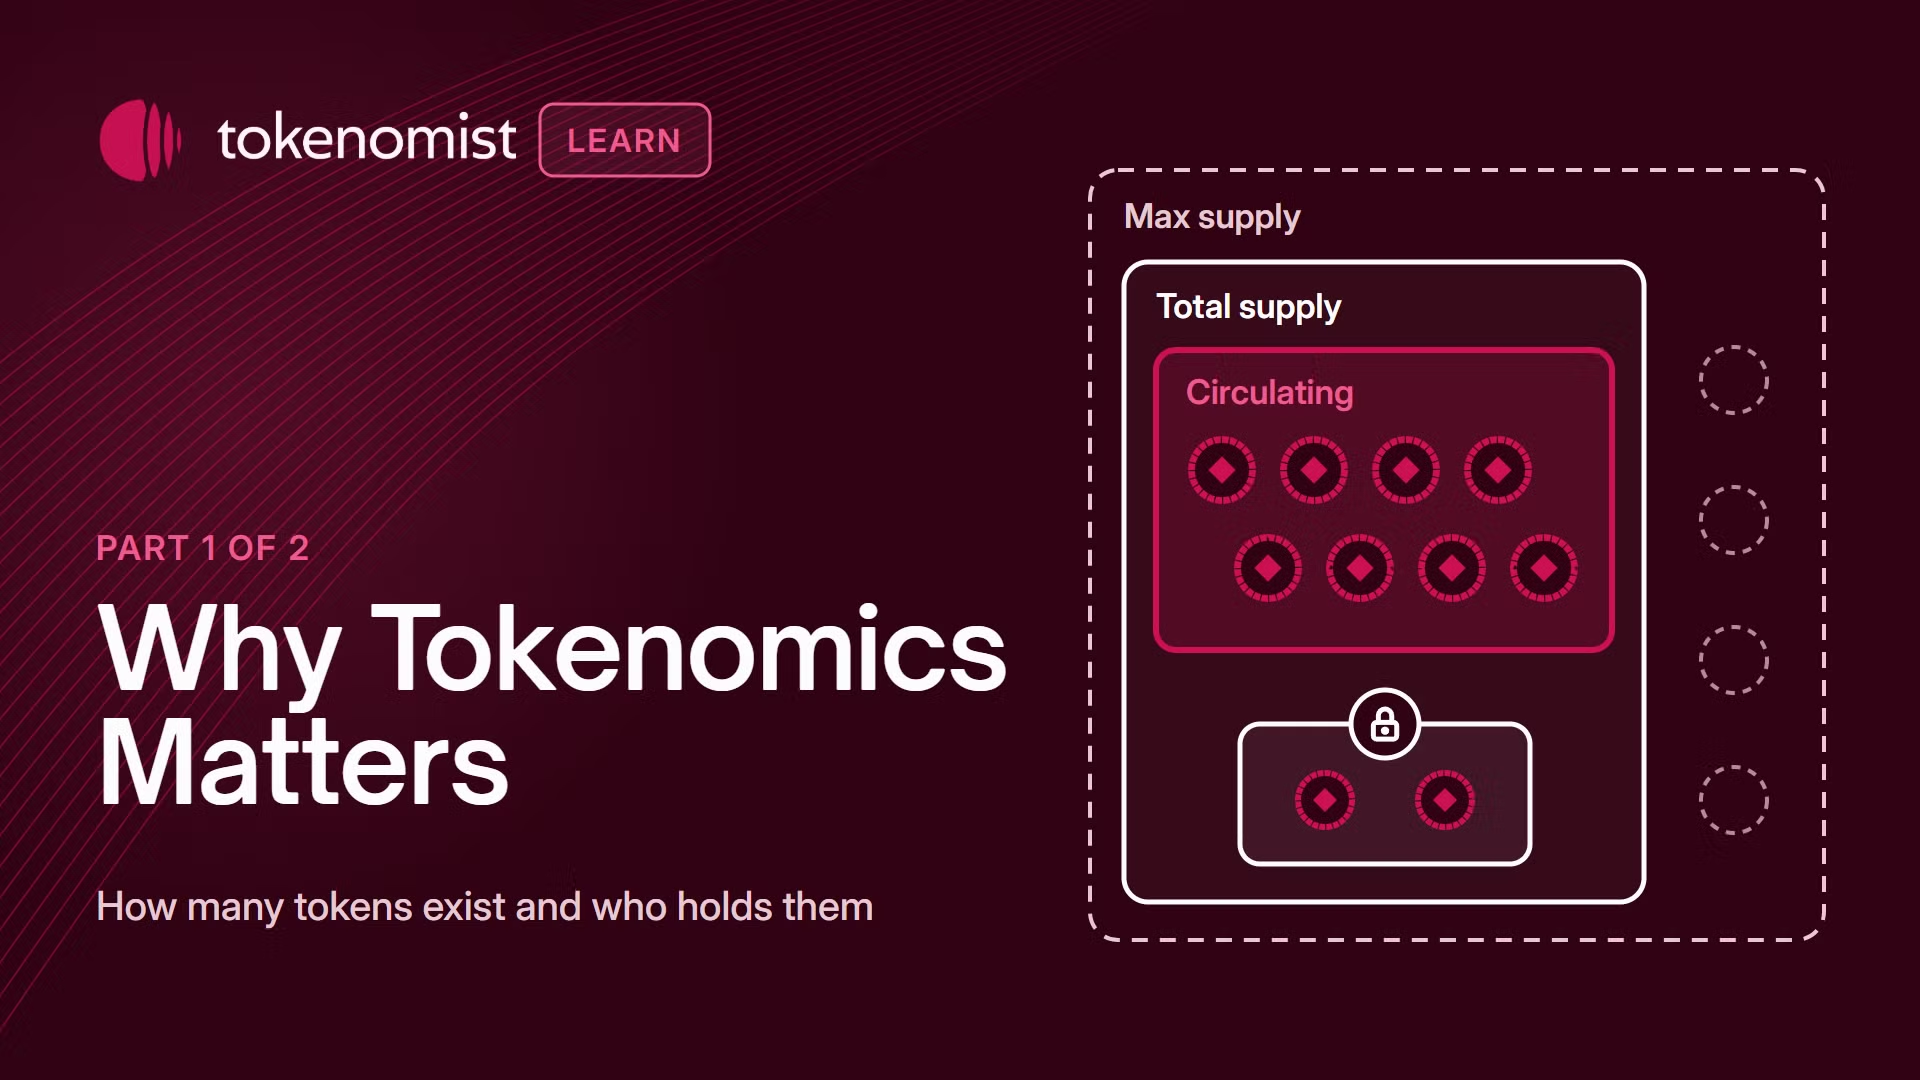
- Supply is counted three ways. Max supply is the most that can ever exist, total supply is what has been minted, and circulating supply is what trades today. The gap between circulating and max is the supply still to come.
- Market cap prices what trades; FDV prices a larger supply count. A wide gap between the two means much of the supply has not reached the market yet.
- A low float means your slice can get thinner. Your tokens stay the same, but as locked supply arrives they become a smaller share of everything that trades.
- Allocation is the plan; unlocks show who receives tokens now. The allocation table sets each group's share at launch, and the unlock record shows which group is actually getting new tokens this year.
- Some supply has no release date. TBD locked supply reaches the market by decision rather than by date, so no calendar can warn you about it.
What tokenomics is and how this series works
This series explains tokenomics one idea at a time. Part 1 covers how many tokens exist and who holds them; Part 2 covers when they reach the market and why anyone holds them. Each section has a picture, a short definition, one line on why it matters and one real example.
1. Three ways to count supply
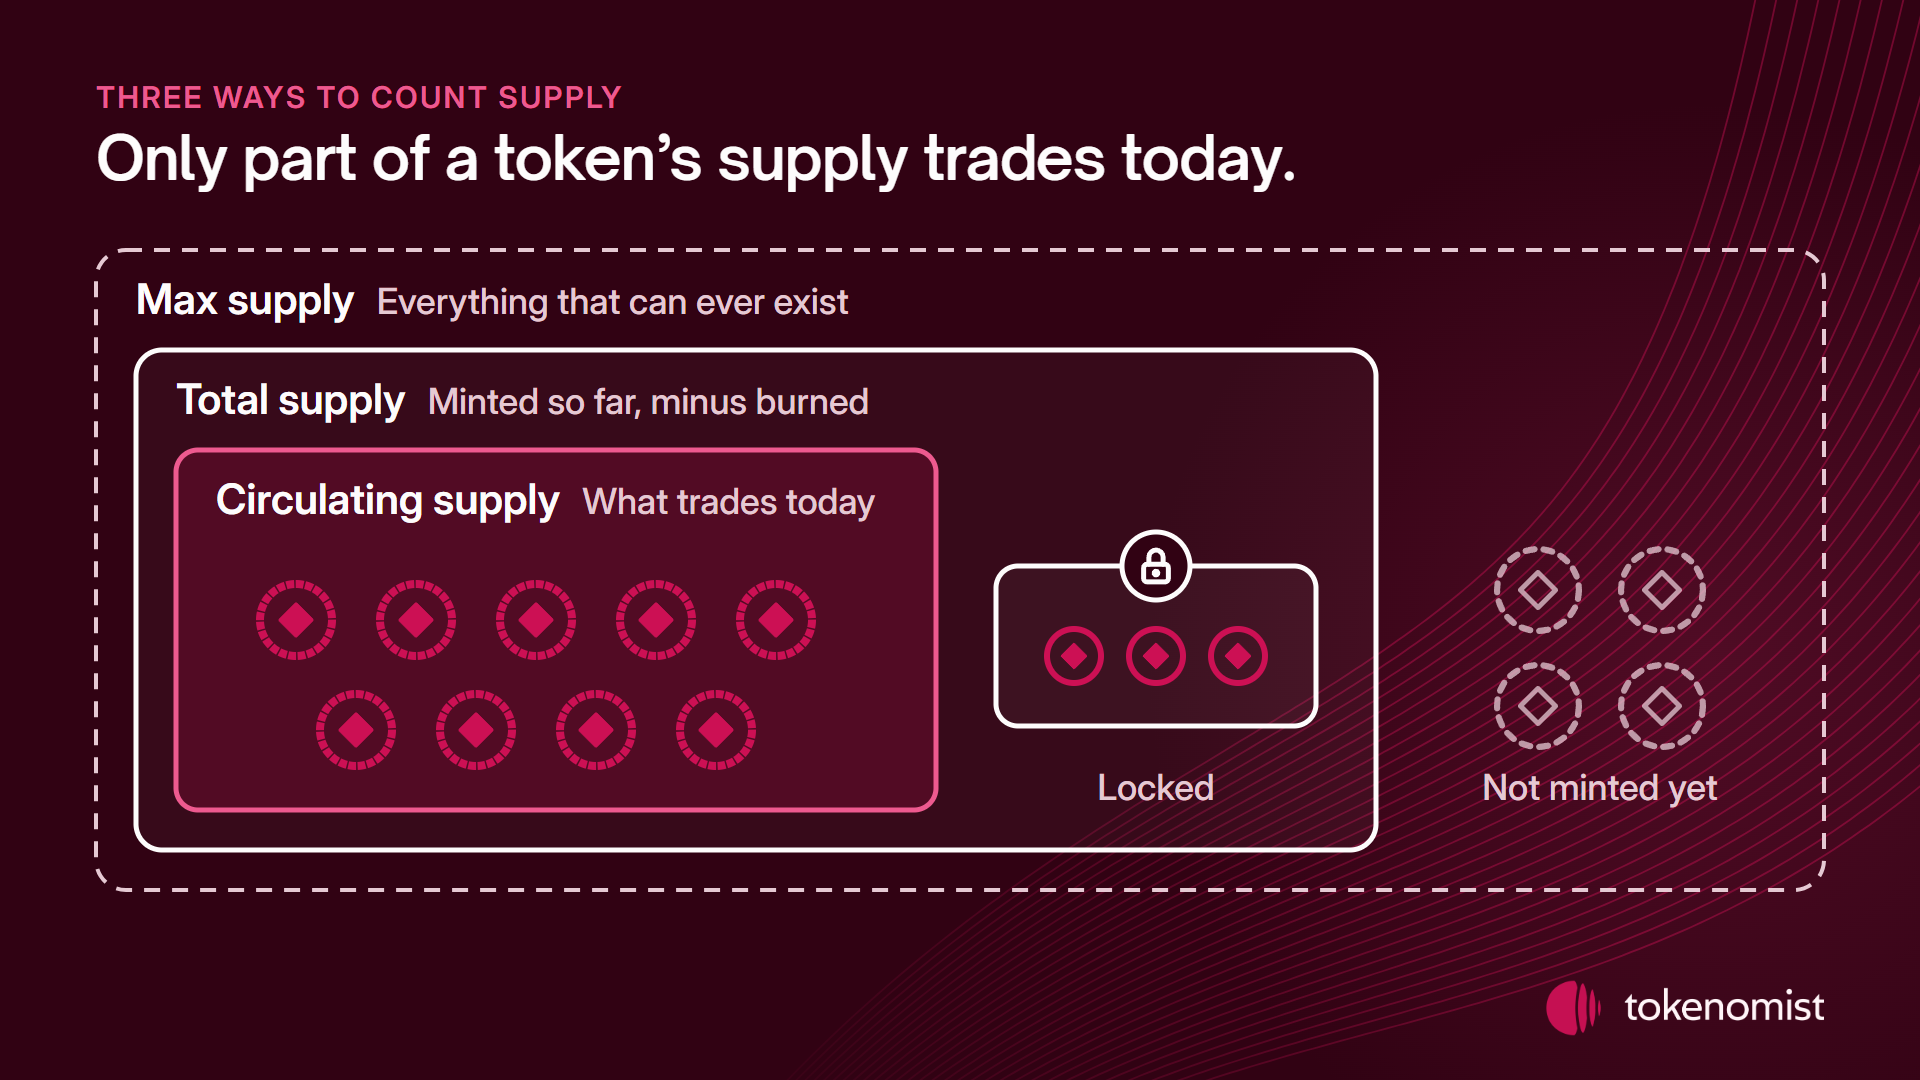
What it is. Max supply is the most tokens that can ever exist. Total supply is what has been minted so far, minus burns. Circulating supply is what trades today.
Why it matters. The gap between circulating and max supply is the supply still to come. Every token in that gap can reach the market later, next to the tokens you already hold, so a token with a wide gap carries more future supply than today's price shows. Max supply also tells you whether new tokens can be created at all.
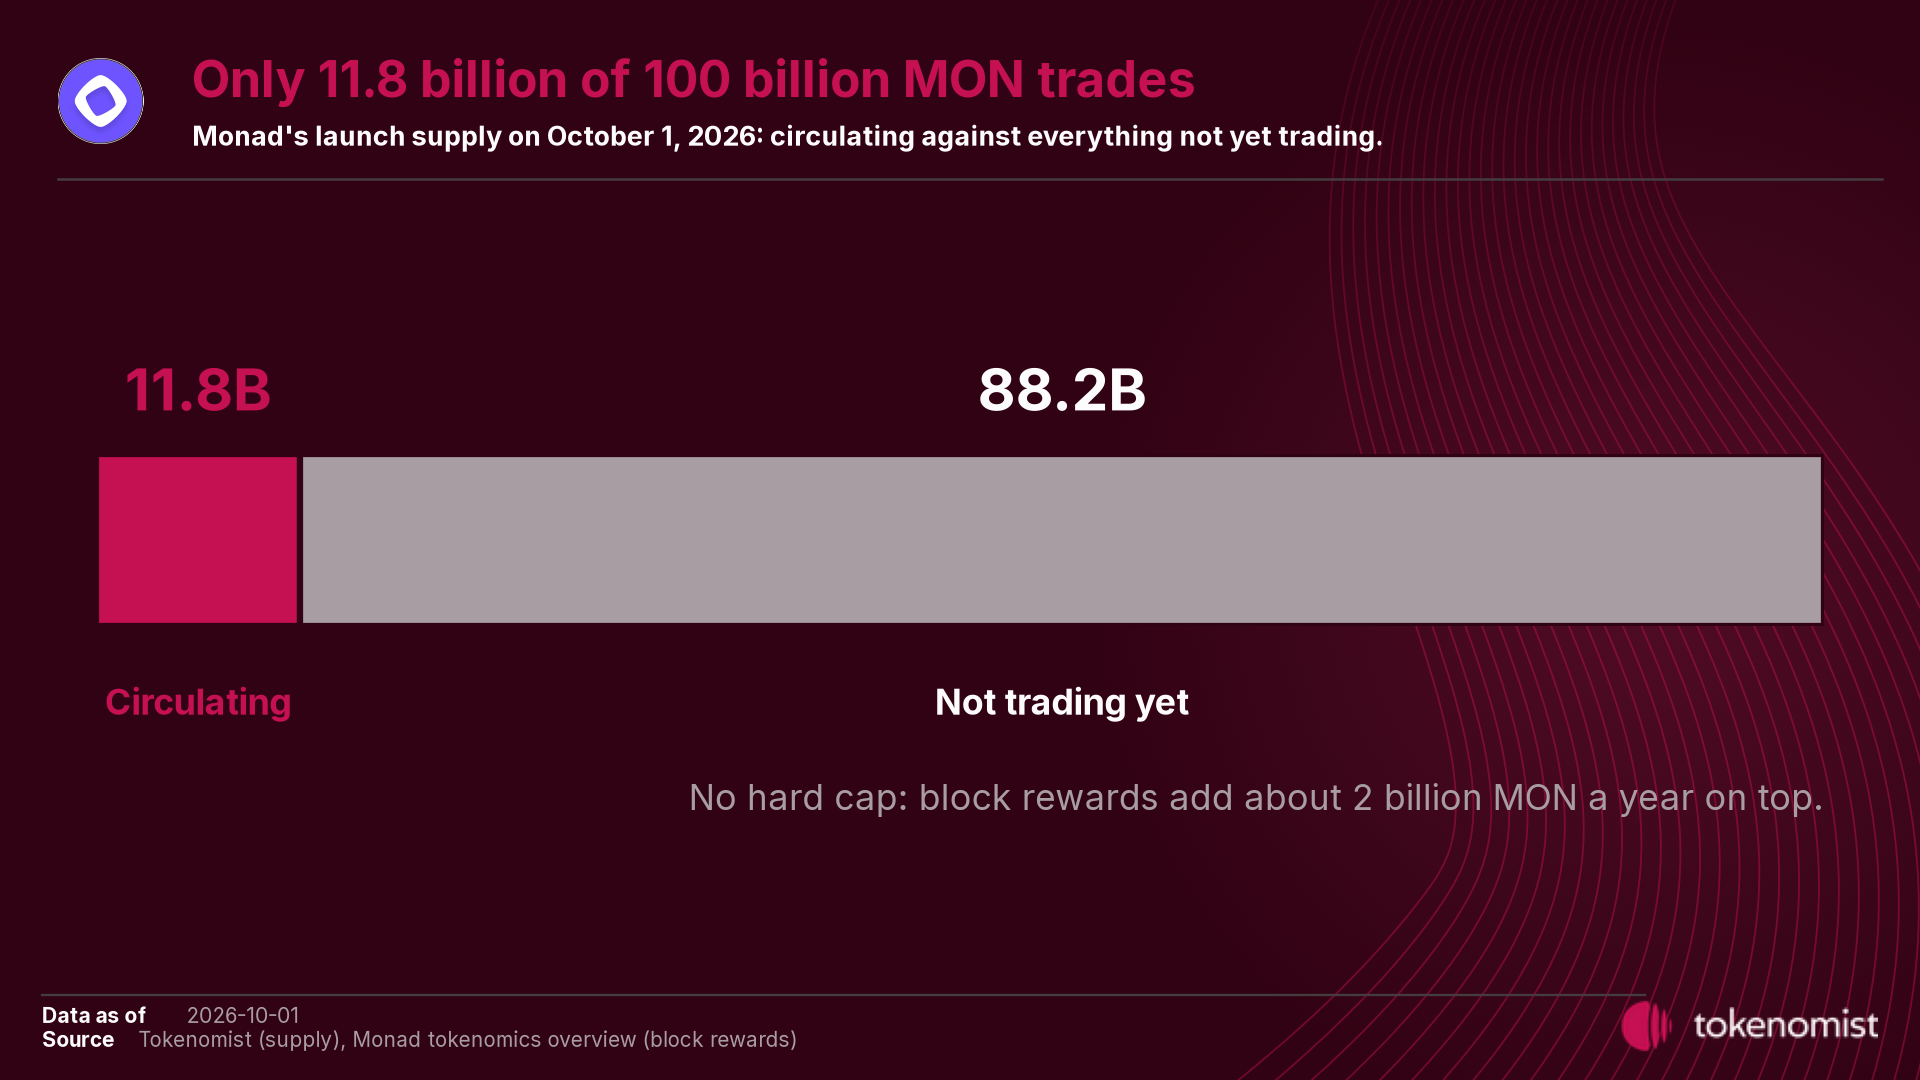
Example. For Monad,
- 11.8 billion MON was in circulation
- out of the 100 billion Monad launched with,
- and block rewards add about 2 billion MON a year on top, per Monad's tokenomics overview.
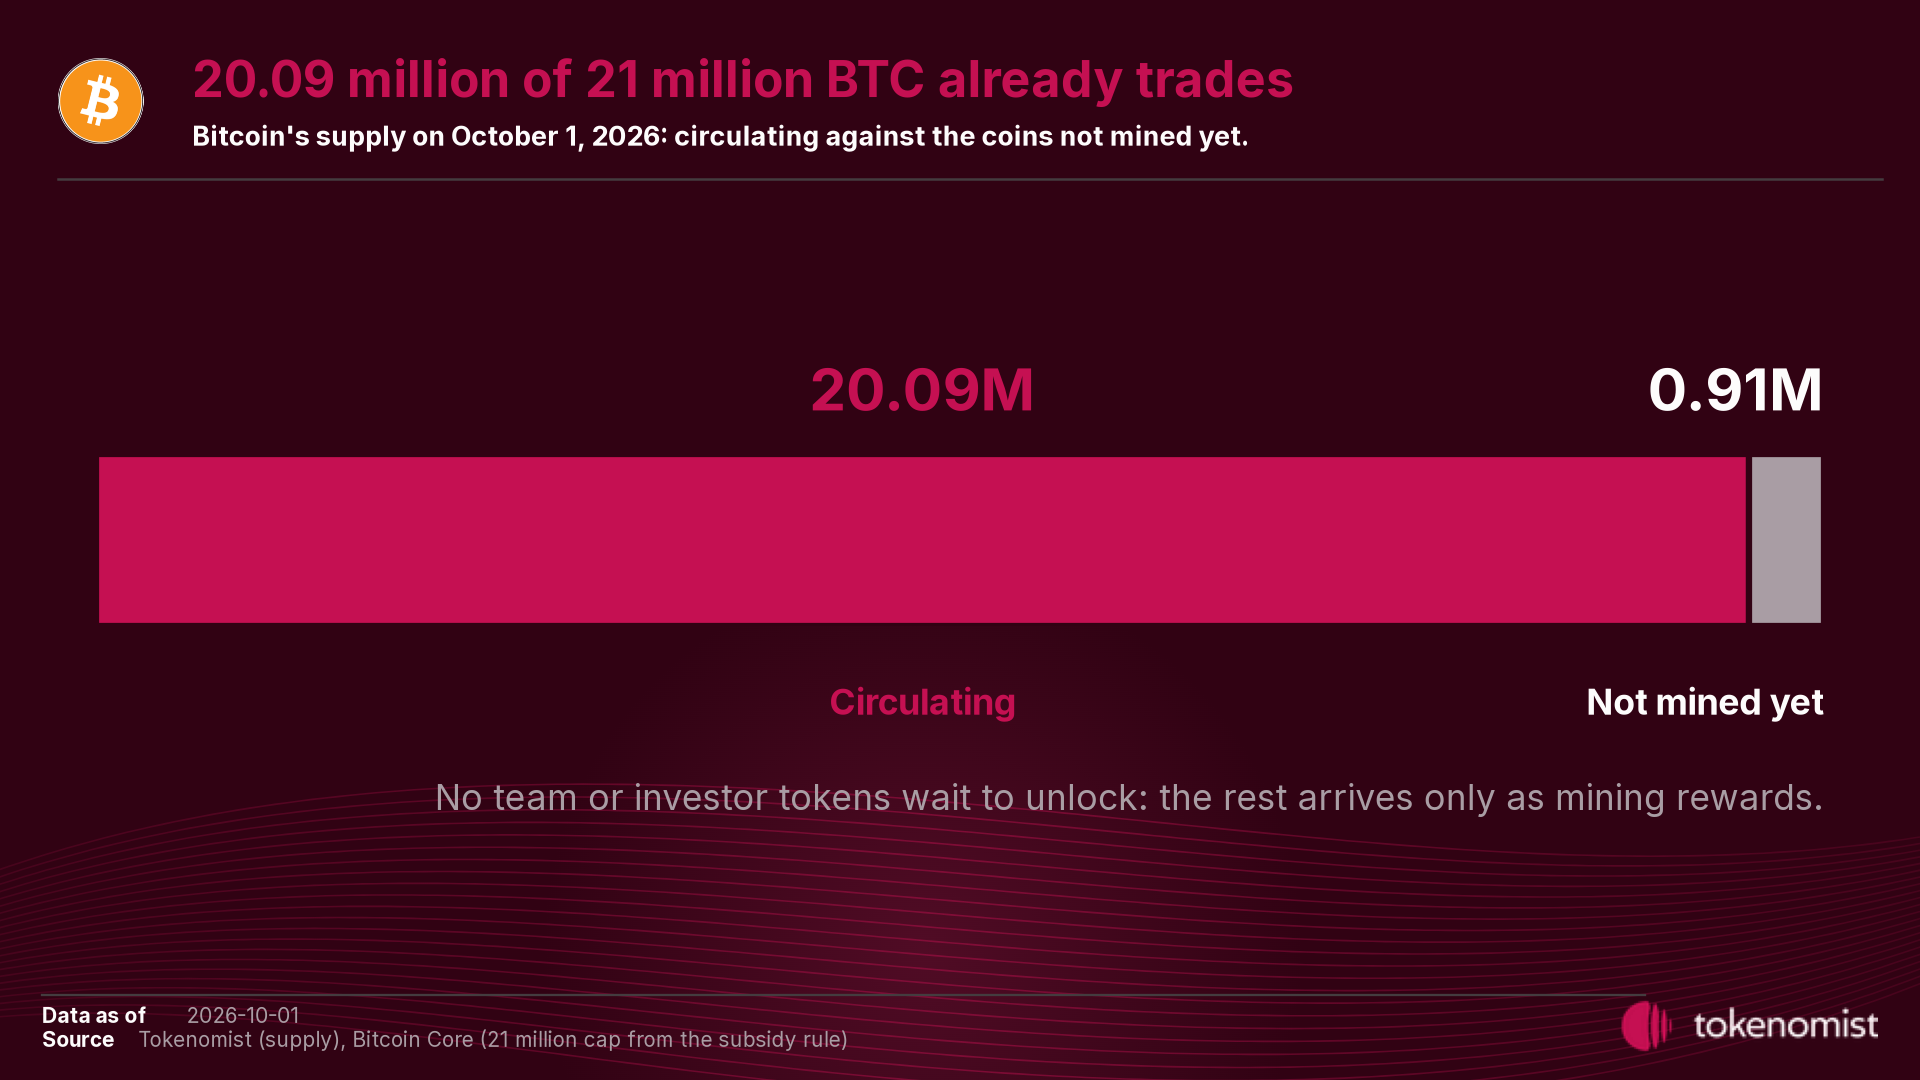
Bitcoin, for comparison. Bitcoin's code starts the mining reward at 50 BTC and halves it every 210,000 blocks, which caps supply just under 21 million. About 20.09 million BTC was in circulation, practically every coin mined so far. No team or investor tokens wait to unlock; the remaining 0.91 million or so arrive only as mining rewards.
2. Market cap and FDV
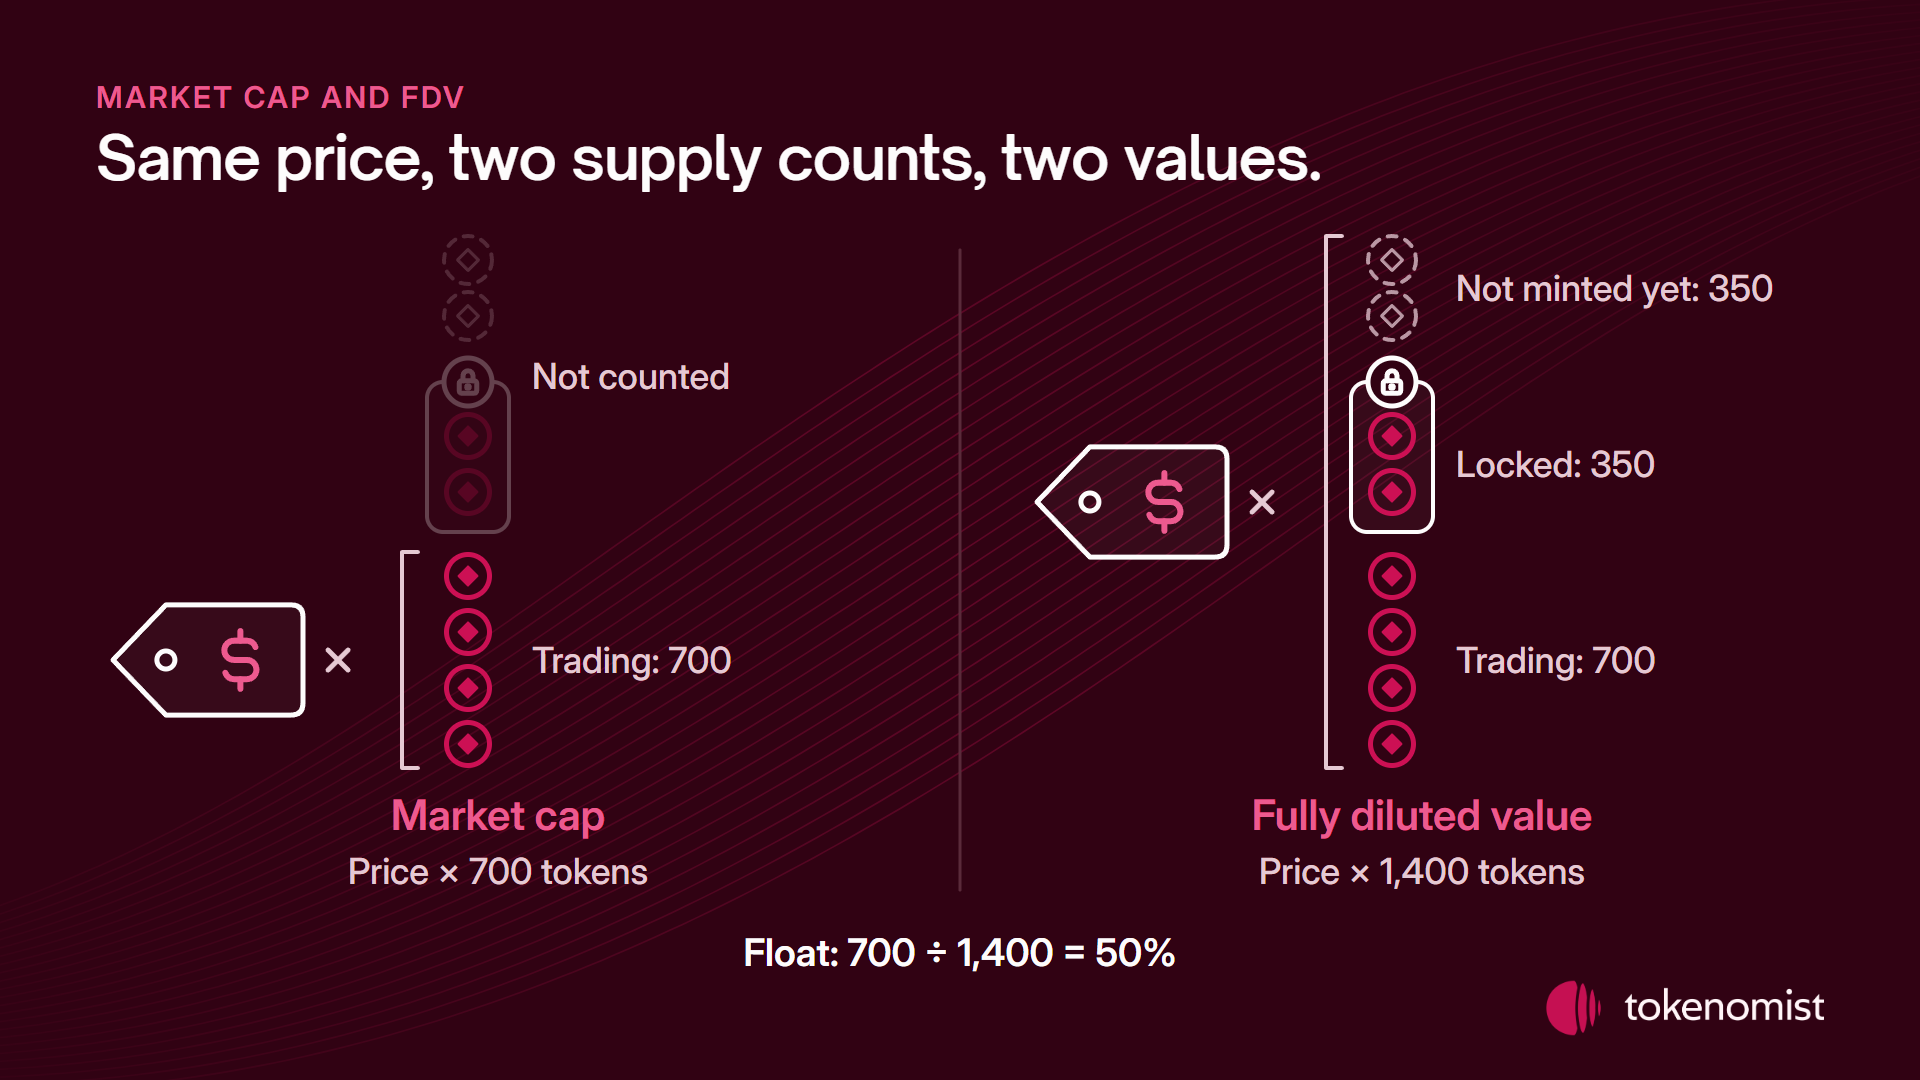
What it is. Market cap is price times the tokens that trade today. Fully diluted value (FDV) is price times a larger supply count, so it shows the value if the rest of the supply were out.
Why it matters. A high FDV next to a small market cap means most of the supply has not reached the market yet. Today's price values only the tokens that trade, and the tokens still to come will need buyers at that price if they are sold. The wider the gap, the more new supply the market may have to absorb.
3. Float
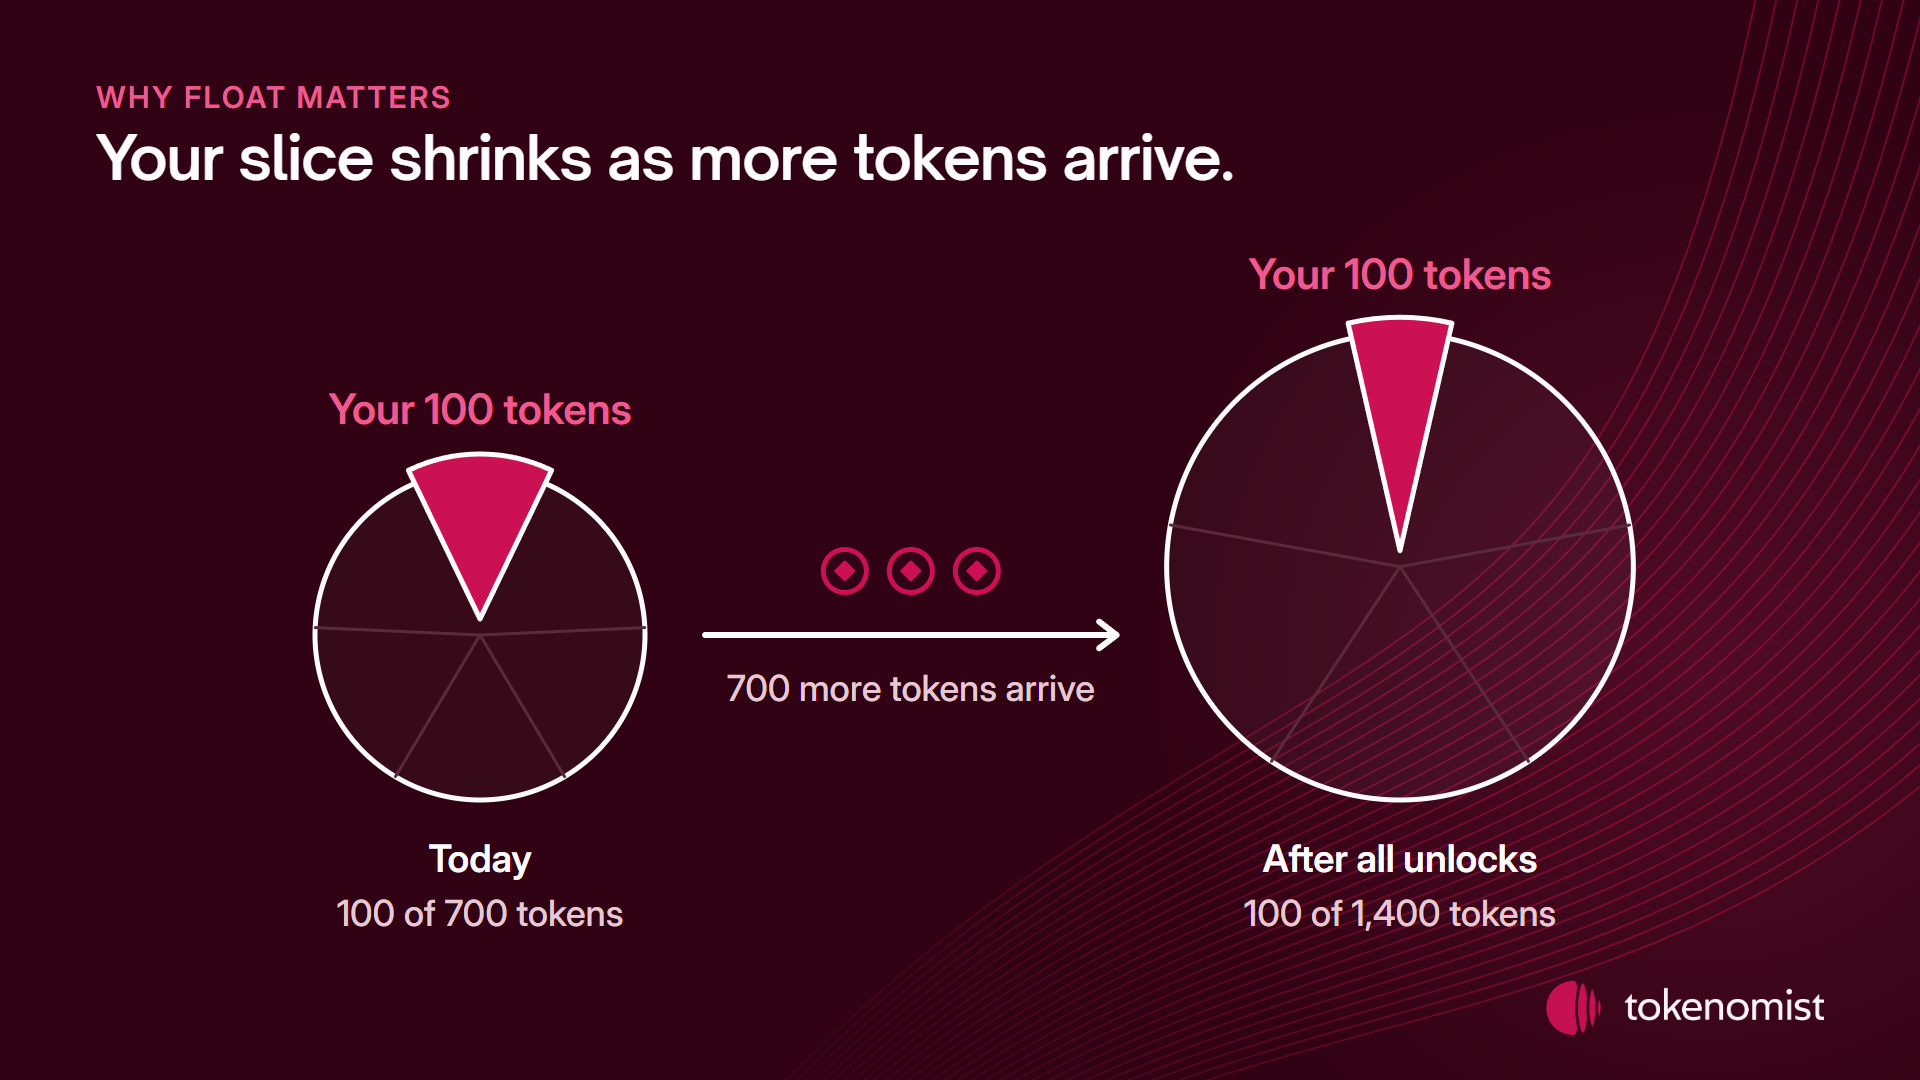
What it is. Float is the share of a token's max supply that already trades. Token pages on Tokenomist show a Float % based on released supply, which reads higher; this series counts only circulating supply.
Why it matters. A low float means more tokens are still to come, and every holder's slice gets thinner as they arrive. Your tokens stay the same, but they become a smaller share of everything that trades. A high float means most of the supply is already out, so future unlocks change less.
Example. Across 59 tokens with a market cap of at least $200 million,
- 18 had less than half of their max supply trading, and the median float was 66.6%,
- Monad's was 11.8% of its 100 billion launch supply,
- Aave's was 96.5%.
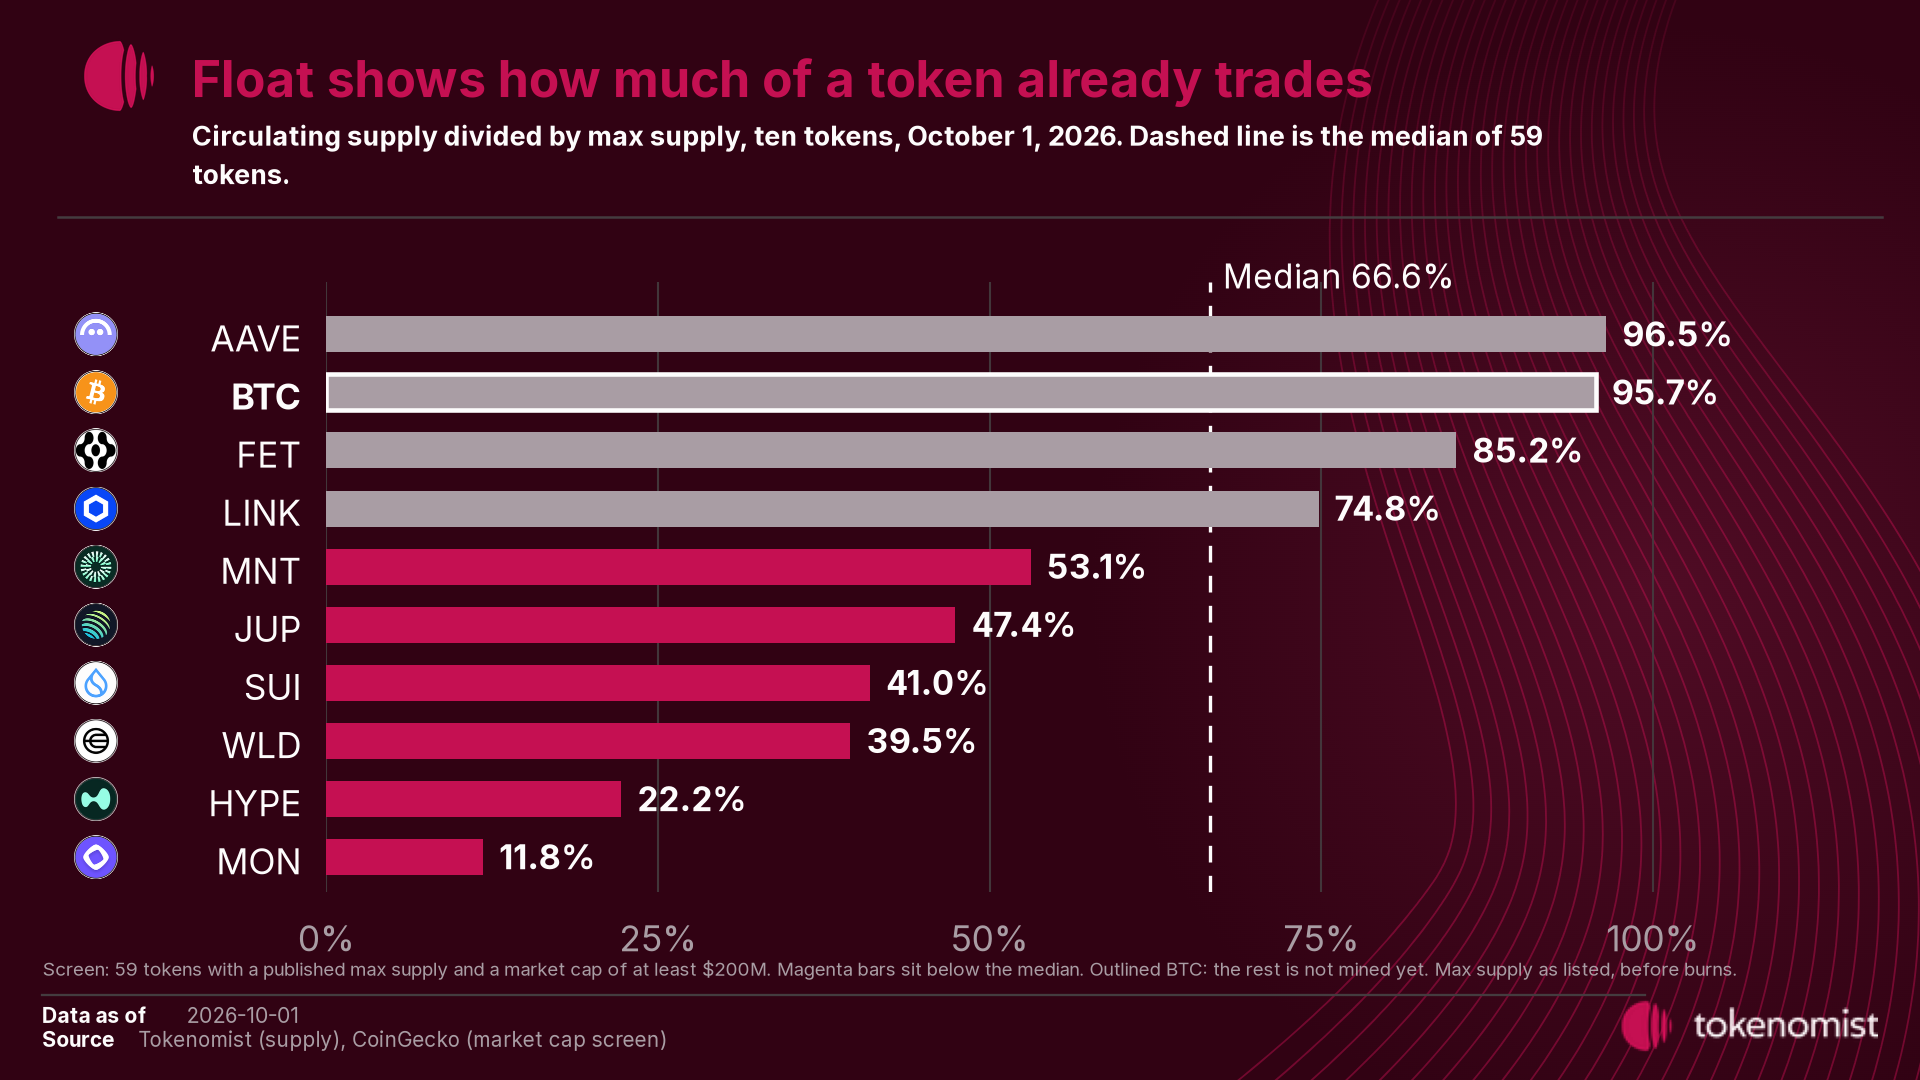
Bitcoin, for comparison. Bitcoin's float was 95.7%. The other 4.3% has not been mined yet, so no team or investor wallet holds it.
4. Allocation
What it is. The allocation table shows who gets each share of the supply, as set at launch: users, a treasury, the team and investors.
Why it matters. It tells you who will receive the tokens that have not arrived yet. Early investors bought at lower prices and the team received its tokens for its work, so their unlocks are the ones holders watch most. The larger their share, the more of the future supply sits with a few holders rather than the wider market.
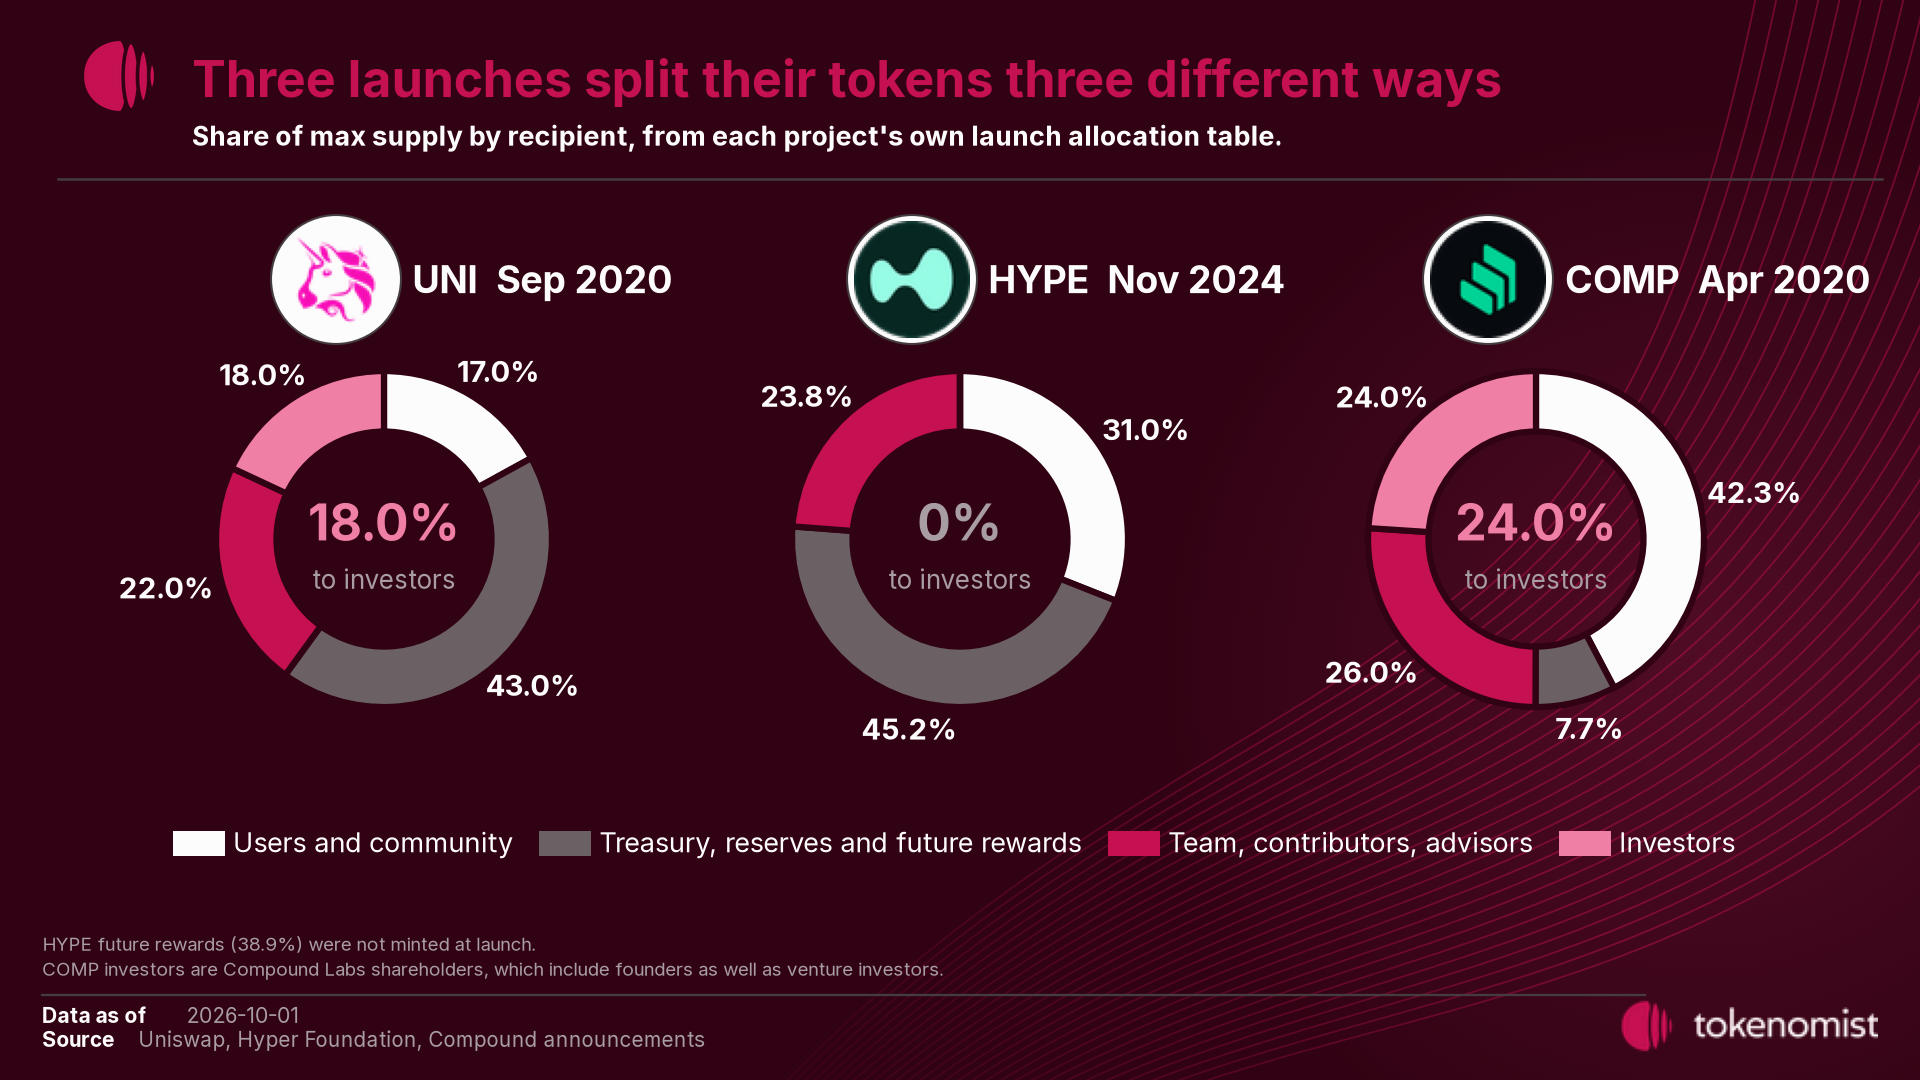
Example. In their launch allocation tables,
- Uniswap set aside 18.044% of UNI for investors in 2020, per its launch post,
- Hyperliquid's HYPE had "no allocations for private investors" in 2024, per its genesis post.
Bitcoin, for comparison. Bitcoin had no allocation table at all. Its whitepaper gives each new coin to the miner of a block, "since there is no central authority to issue them," so no team, investor or treasury share was set aside.
We’re thrilled to announce that UNI, the Uniswap Protocol governance token, is live now on Ethereum mainet!
— Uniswap (@Uniswap) September 17, 2020
Read more:https://t.co/RD3mwEUyHn
Ethereum Address: 0x1f9840a85d5af5bf1d1762f925bdaddc4201f984
5. Who receives unlocks
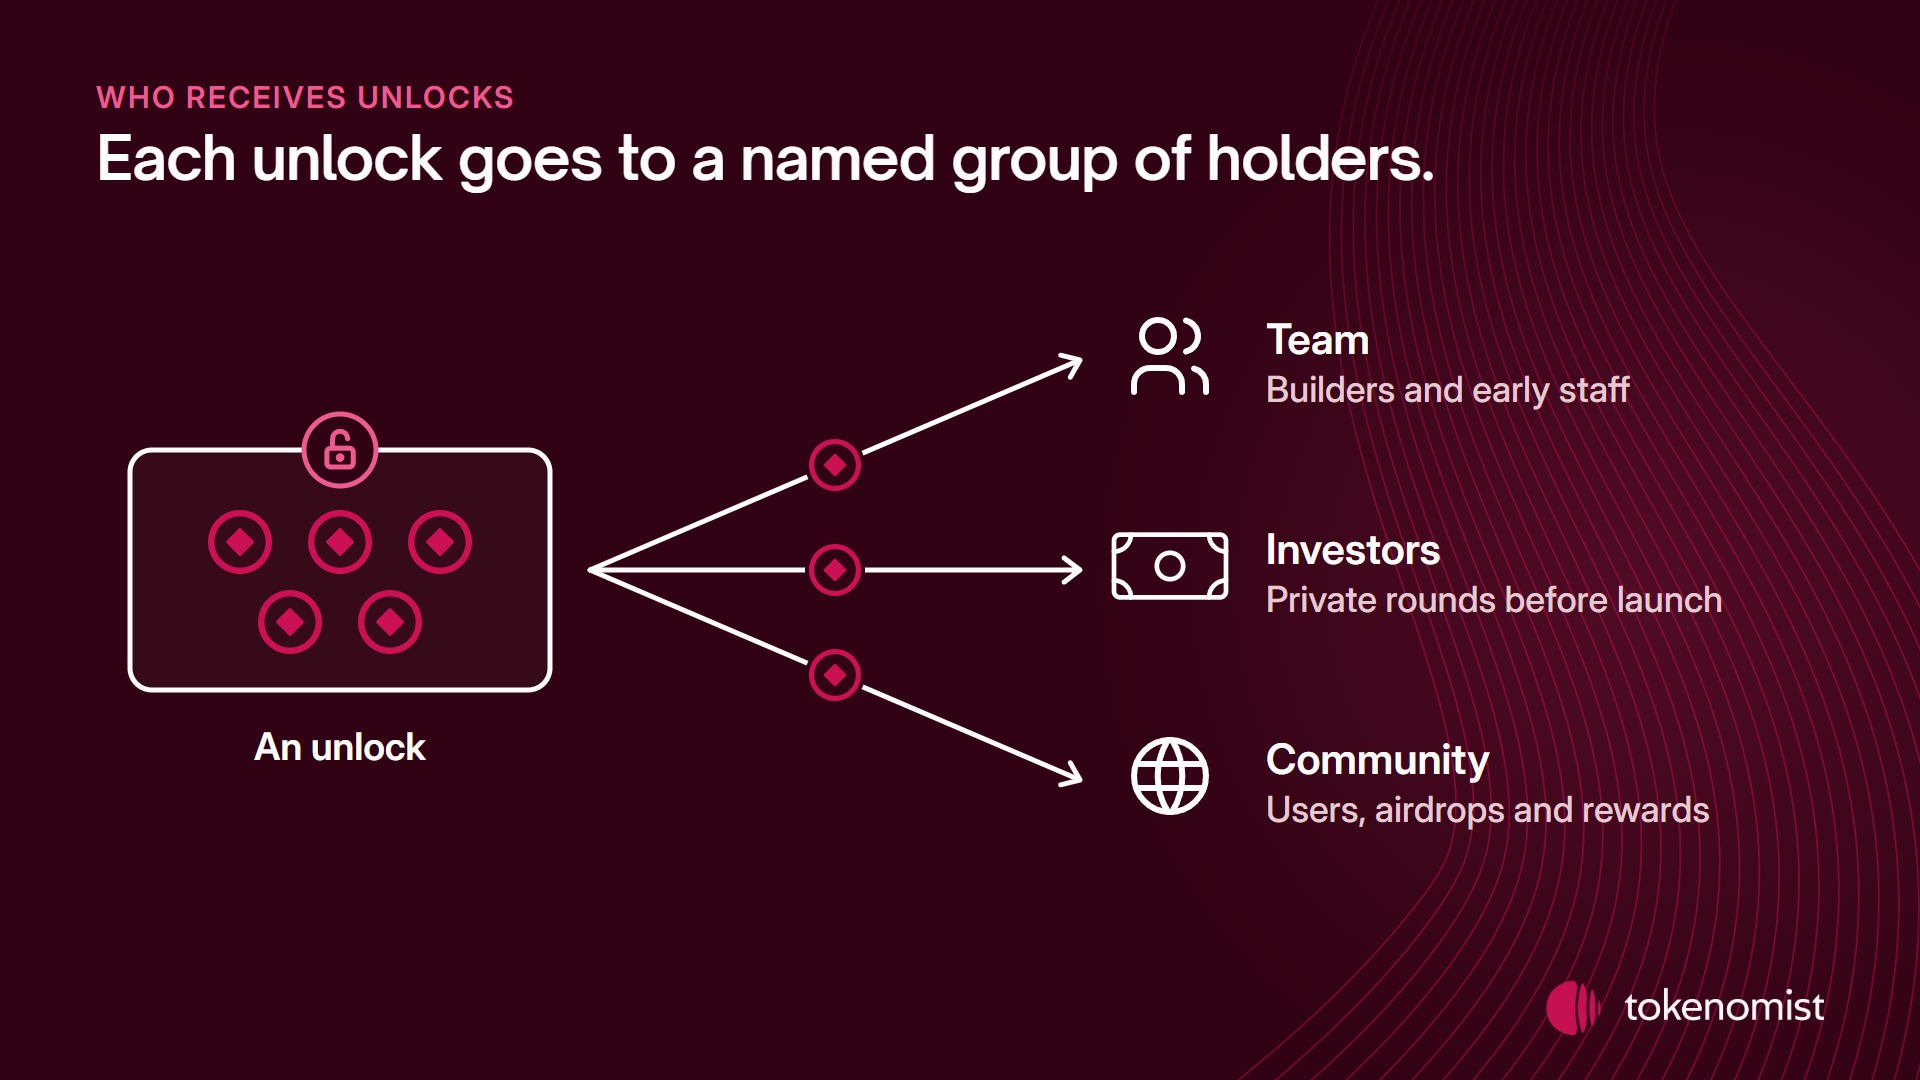
What it is. Every unlock belongs to an allocation, so you can see which group receives the tokens.
Why it matters. It shows who is getting new tokens now, not only who was promised them at launch. The allocation table is a plan made at launch; the unlock record shows which group is actually receiving tokens this year. If most of this year's unlocks go to the team and early investors, the new supply is concentrated in a few hands.
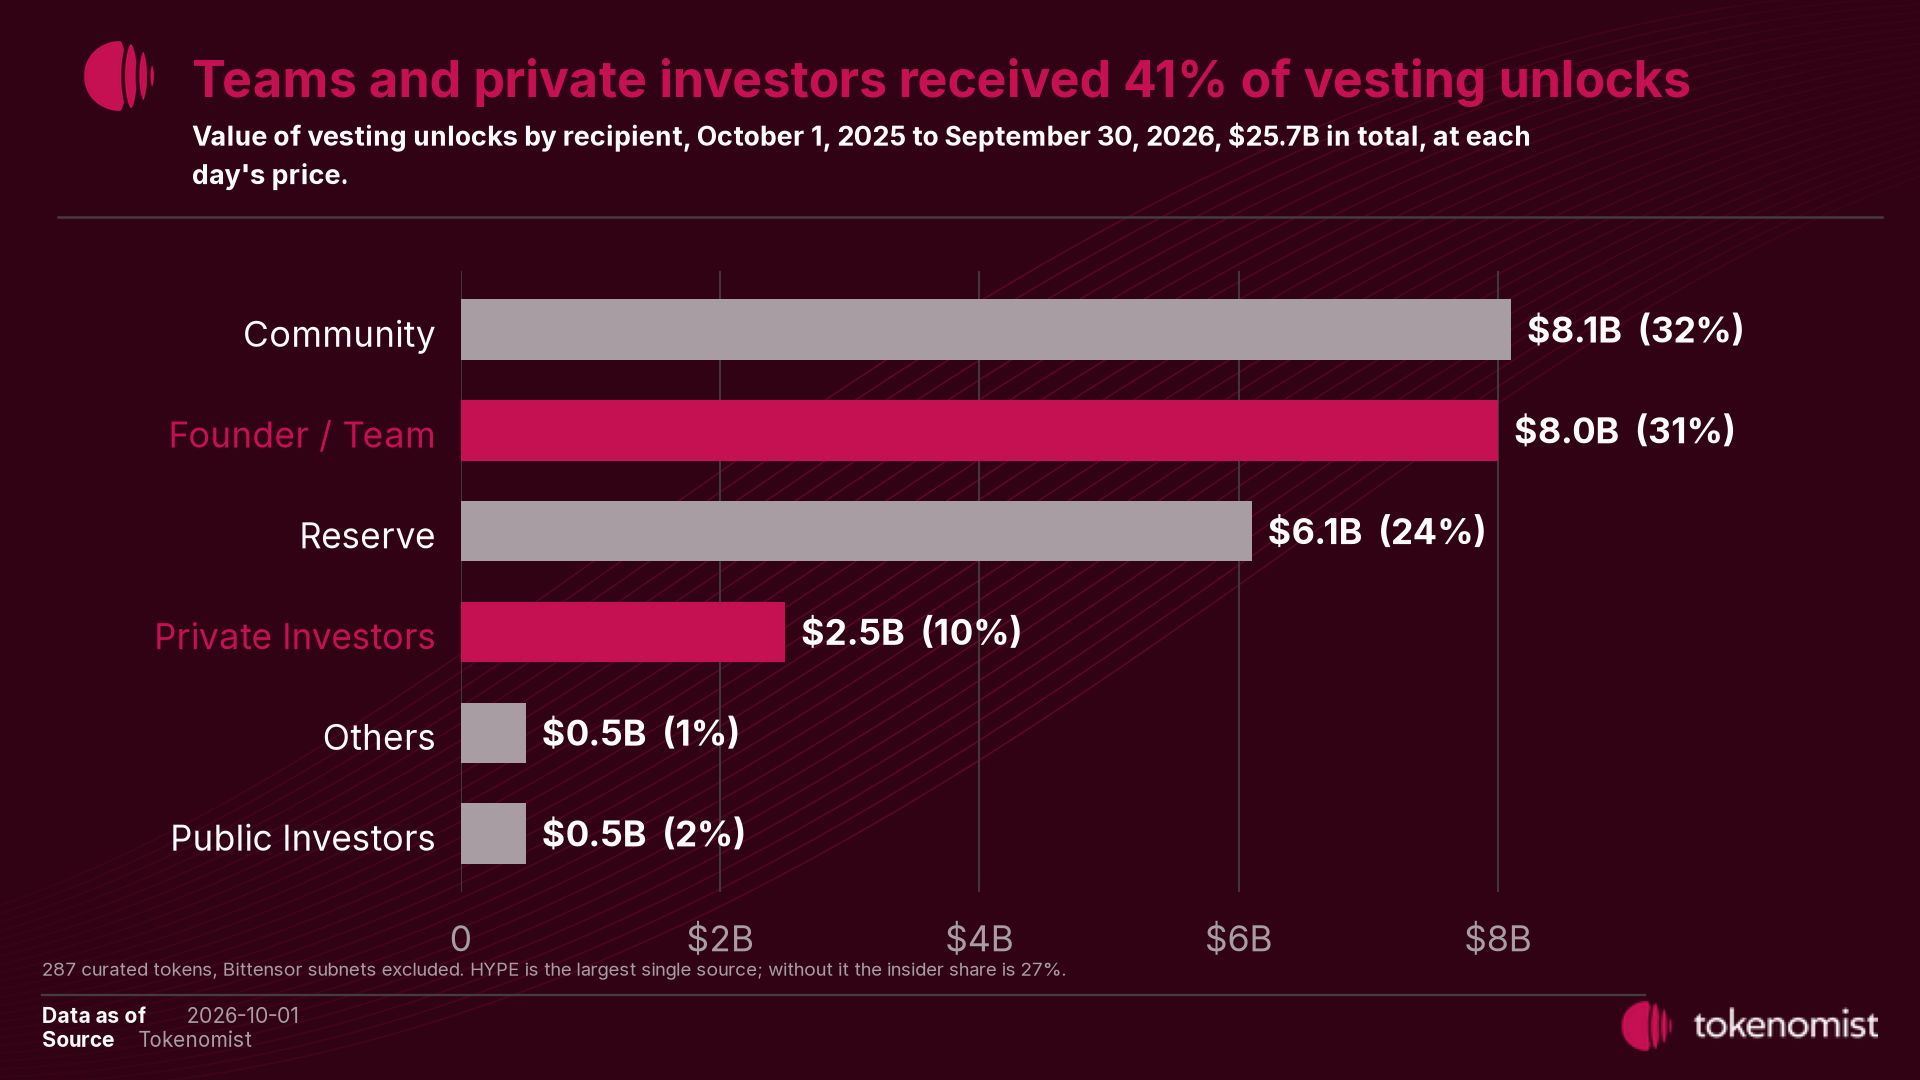
Example. Between October 1, 2025 and September 30, 2026,
- vesting released $25.7 billion of tokens across the 287 tokens Tokenomist curates,
- teams and private investors received $10.5 billion of it, or 41%,
- and HYPE's team allocation supplied $4.8 billion of the $10.5 billion, on a schedule Tokenomist estimates.
6. TBD locked
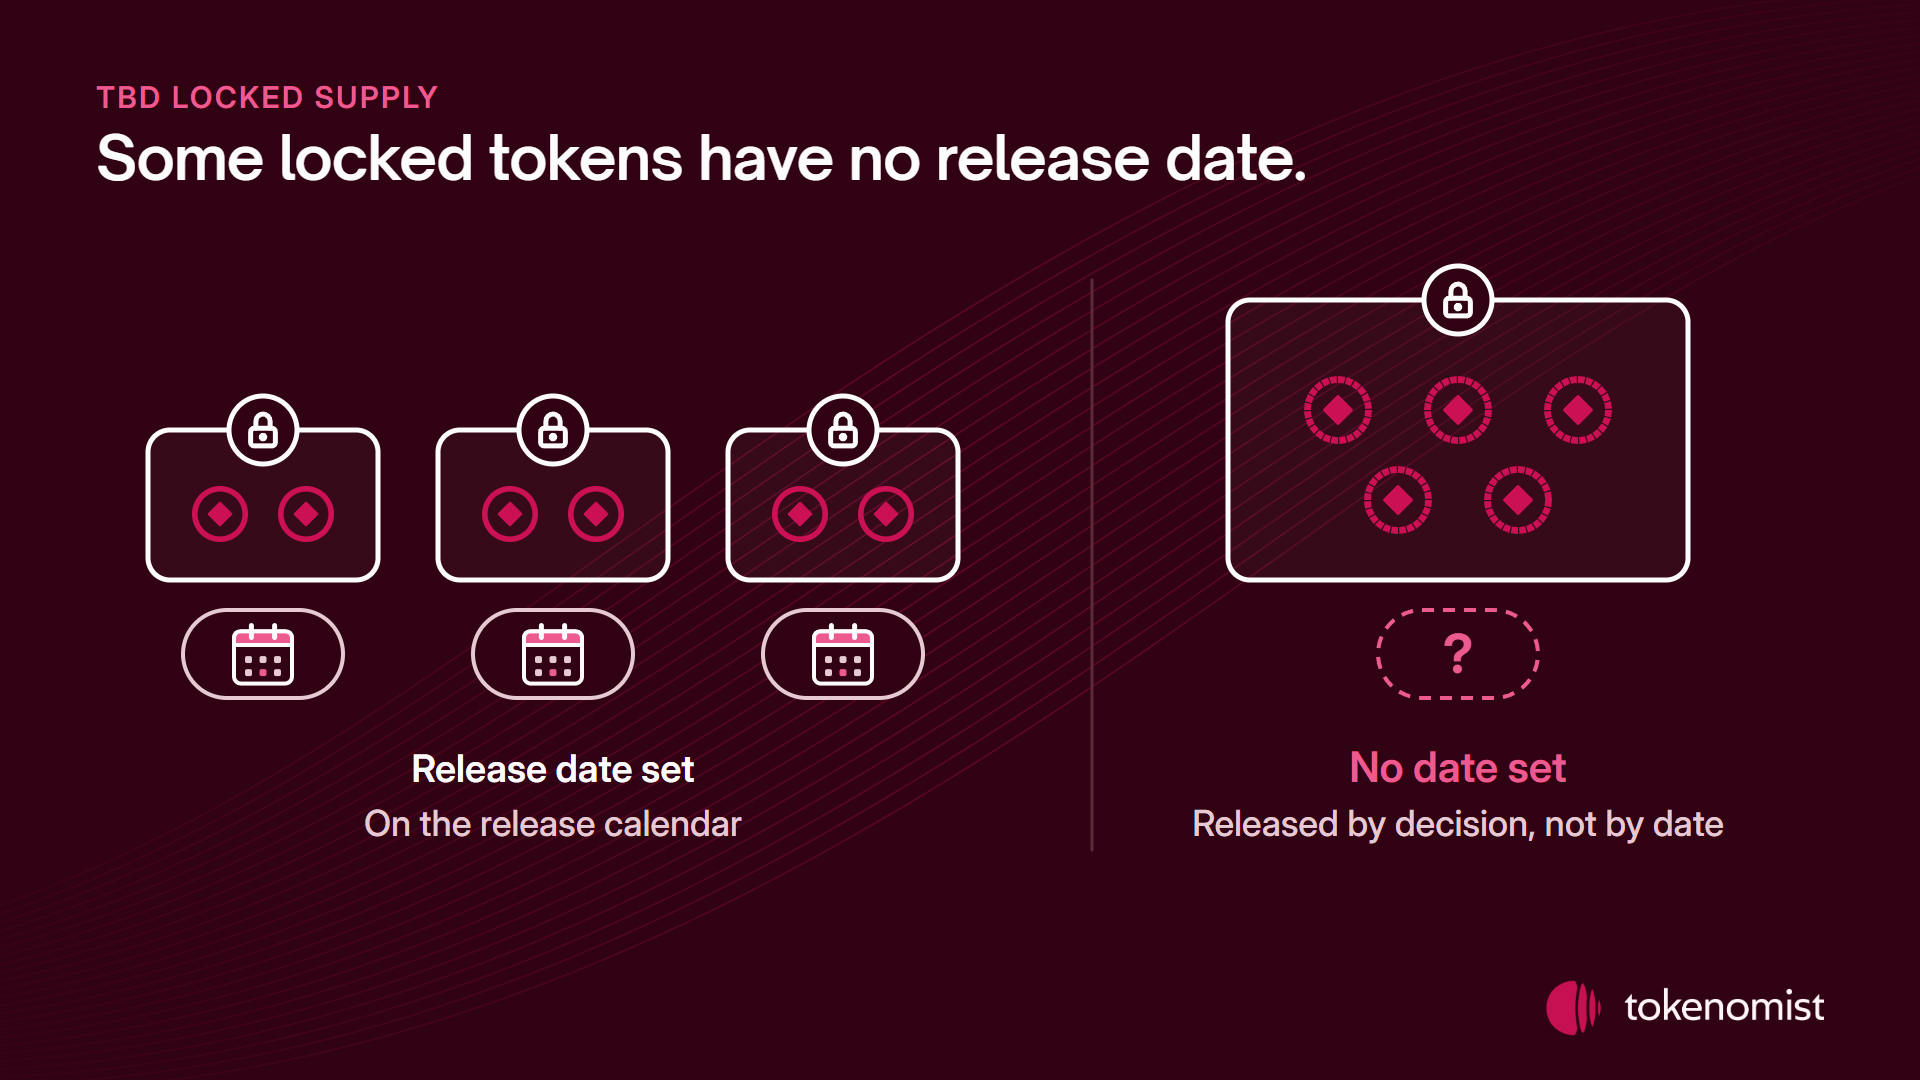
What it is. TBD locked supply is locked with no release date.
Why it matters. A calendar cannot warn you about it, because it reaches the market by decision rather than by date. A governance vote or a team decision can release it at any time, so it is supply you cannot plan around. The larger the TBD share compared with circulating supply, the bigger that uncertainty.
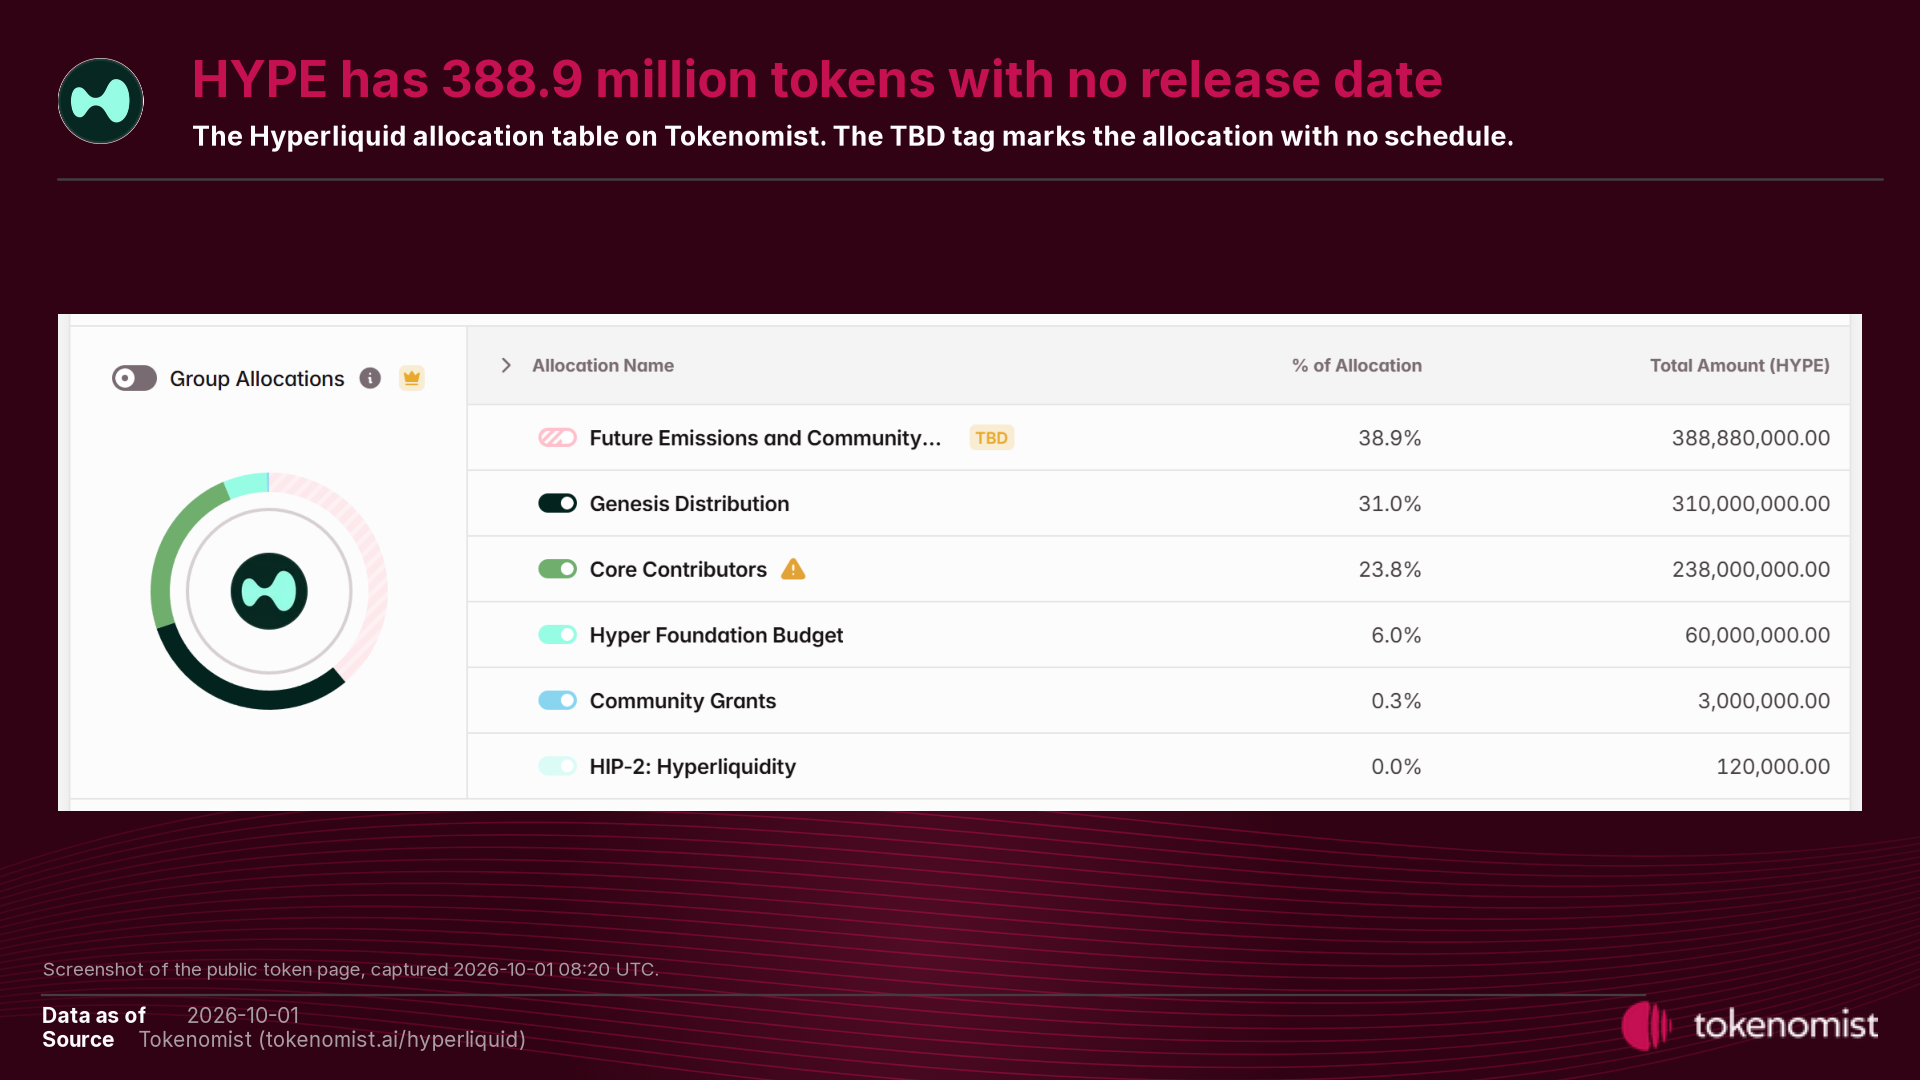
Example. On Hyperliquid's token page,
- Hyperliquid had 388.9 million HYPE TBD locked,
- more than the 222.4 million HYPE in circulation.
What Part 2 covers
Part 2 covers when tokens reach the market and why anyone holds them, and ends with six questions to ask any supply page.
Methodology
- Supply, schedules and unlock values: Tokenomist, pulled October 1, 2026, 05:54 to 06:05 UTC; 287 curated tokens, Bittensor subnets excluded.
- Market cap: CoinGecko, about 06:00 UTC; float screen of tokens worth at least $200 million, leaving out BGB, whose listed max supply does not net out burns.
- Unlock values use each day's price; HYPE's core contributor schedule is a Tokenomist estimate.
- Not checked: how much unlocked supply was sold.
Sources
- Tokenomist: supply metrics methodology
- Monad: MON tokenomics overview
- Uniswap: Introducing UNI
- Hyper Foundation: HYPE genesis
- Compound: Compound governance
- Satoshi Nakamoto: Bitcoin whitepaper
- Bitcoin Core: block subsidy code
- Bitcoin Core: chain parameters
Frequently Asked Questions
What is tokenomics?
Tokenomics is the set of rules that decides how many tokens of a cryptocurrency exist, who received them, when they reach the market and what gives holders a reason to keep them. It covers supply, the allocation table, the release schedule, new issuance, and burns and buybacks.
What is the difference between market cap and FDV?
Market cap is the token price times the circulating supply, the tokens that trade today. Fully diluted value is the price times a larger supply count that also includes tokens not trading yet. The gap between the two shows how much supply has not reached the market yet.
What does TBD locked mean?
TBD locked supply has been allocated but has no published release date. It is often kept for future rewards, grants or a treasury. It is not automatically sold, but a release calendar cannot show when it will reach the market. Hyperliquid had 388.9 million HYPE TBD locked on October 1, 2026.
Recommend Article